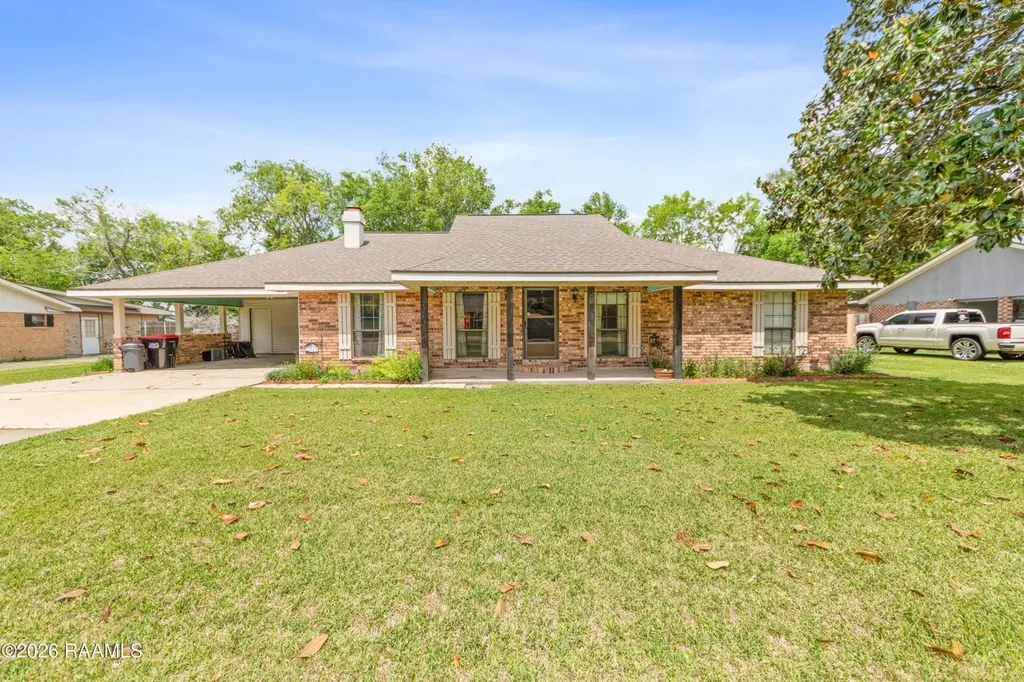
114 Hesper Dr · Carencro, LA
Flood risk 1/10 · Minimal
- FEMA flood zone
- X (unshaded)
- Chance of flooding over 30 yrs
- 0.0%
- Est. flood insurance / yr
- $507 – $1,088
Fire risk 2/10 · Minimal
- Est. fire insurance / yr
- $1,269 – $2,357
Heat risk 8/10 · Major
- Hot days now (above 109°F)
- 7 days/yr
- Hot days in 30 yrs
- 20 days/yr
Wind risk 9/10 · Severe
- Chance of severe wind over 30 yrs
- 99.0%
Air-quality risk 2/10 · Minimal
- Unhealthy air days now
- 0 days/yr
- Unhealthy air days in 30 yrs
- 1 days/yr
Risk factors via First Street. Map © Google.
Why this score? — see what drove the D grade
The composite is a weighted blend of 9 inputs, each scored 0–100. Each bar is that input's sub-score; the figure is the points it added to the 100-point composite (weight × sub-score).
- ARV discount +12.4/15.0
- Cash flow +11.5/30.0
- Schools +3.6/10.0
- Livability +3.5/5.0
- DSCR +3.4/10.0
- Rent growth +2.5/5.0
- Condition / age +2.5/5.0
- 1% rule +2.4/10.0
- Appreciation +0.0/10.0
$225,000
🖨 Deal sheet (PDF) 📄 Offer letter ✓ Due diligence
Listing remarks
Welcome to 114 Hesper Road, a beautifully maintained 3-bedroom, 2.5-bathroom residence offering 2,005 square feet of comfortable living space. Situated on a generous 0.34-acre lot in the established Cajun Village subdivision, this traditional brick home perfectly blends classic architectural appeal with a spacious, functional layout. Situated on a quiet dead-end street, ensuring minimal traffic and a peaceful residential atmosphere. Enjoy the benefits of an established neighborhood without the noise of a through-way street. Schedule a showing to check it out today!
Key facts
- 0.34 acre lot
- 2 parking spots
- Built 1980
Property features AI
Exterior
- Parking: Attached carport with 2 covered spaces; Open parking (total 2 spaces)
- Utilities: Public sewer; Electric service by Entergy
- Home design: Single family residence
- Construction: Brick construction; Composition roof
- Exterior features: Composition roof; Brick and brick veneer exterior; Shed/storage structure on property; City street frontage (paved)
Interior
- Flooring: Carpet; Tile
- Bathrooms: 2 full bathrooms
- Heating & cooling: Central heating (electric); Central air conditioning
- Interior features: High ceilings; Built-in bookcases; Cathedral ceilings; Formica counters; Solid surface counters; Wood-burning fireplace
Neighborhood map
What this means for you Summary
Snapshot
- This is a 3-bed/2.0-bath single-family listed at $225k.
Deal economics
- At list price, monthly cash flow is $-76 ($-913/yr) — negative.
- To cash-flow at today's rent, offer at most $212k (6.0% below list).
- To meet the 1% rule (rent ≥ 1% of price), the offer needs to be $168k (25.6% below list).
- Recommended offer: $168k (25.6% below list) — sets the bar for 1% rule.
Location & tenants
- Location reads 69/100 on livability (#65 in LA) — a middle-class / working-renter tenant base. Strengths: cost of living A+, housing A+, health & safety A+; Watch: employment C-, crime D, amenities F.
- Lafayette Parish (urban): math 38% / reading 46% proficiency, ranked #19 of 98 in LA (top 19%) — families likely to look elsewhere, expect single-tenant / working-renter base with shorter leases.
- Zoned schools: J. Wallace James Elementary School (math 46% / reading 49%, grade D, #147 of 646 statewide, top 23%, 939 students, 64% FRL); Carencro Middle School (math 18% / reading 28%, grade F, #145 of 218 statewide, top 69%, 665 students, 75% FRL); Carencro High School (math 30% / reading 29%, grade F, #127 of 265 statewide, top 49%, 1,096 students, 69% FRL).
- Market conditions: 281 active listings in the ZIP; 2 comparable units currently listed for rent nearby; 1,585 units permitted in Lafayette Parish in 2024 (10 in 5+ unit buildings).
Forward outlook
- Local home prices are declining (-3.0%/yr); year-one equity from $2k of loan paydown is wiped out by about $7k of value loss. Plan a longer hold.
- Lafayette County population projected at +34% by 2050 — long-run rental-demand tailwind backs the buy-and-hold thesis.
Negotiation context
- It's been on market 44 days — a 3% lower offer ($218k) is reasonable based on typical stale-listing flexibility.
- 2 sale attempts since 2y ago with the ask held roughly flat each time — persistent listings suggest the price (not the market) is what's stuck; bring a comps-based counter.
Risks & watch-outs
- Climate carrying-cost: severe wind risk, 99% chance of damaging wind over 30y; extreme-heat days projected 7→20/yr by 2055 (HVAC capex compounding) — expect insurance premiums to compound above CPI over the hold.
Questions for the listing agent
- What do current leases actually rent for vs. the listed asking? Can we see a recent rent roll and the last 12 months of T-12 income?
- It's been on market 44 days. Have you received any prior offers? Is the seller open to a 26% concession, seller financing, or rate buy-down credit?
- Is there a deadline driving the sale (1031 exchange, divorce, estate, relocation)? That informs how much negotiation room exists.
- Crime grade is D in this area — have there been break-ins, vandalism, or insurance claims at this property in the last 3 years? What carrier currently insures it and at what premium?
- The area grade is low — what's the realistic commute time and amenity access for the typical tenant pool here? Any planned neighborhood developments (good or bad) we should know about?
- What's the average days-on-market for RENTAL listings here right now (not sales)? A rising rental-DOM trend means longer vacancies and softer asking-rent achievability than the comps imply.
- What's the recent tenant-quality profile in this submarket — average credit score on applications, eviction rate, late-payment / NSF rate, and stable-employment percentage? A property-management company in the area should have these aggregated.
- How much new for-sale + rental construction is in the pipeline within 1–3 miles? Heavy new supply typically softens prices + rents 12–24 months out; constrained supply supports both.
Investment metrics
- 1% rule
- 0.74% ✗
- Cap rate
- 5.89%
- Cash-on-cash
- -1.45%
- DSCR
- 0.94
- GRM
- 11.2
CMA / ARV
- ARV (median comp)
- $252,363
- List price
- $225,000
- Delta
- -10.84%
- Verdict
- UNDERPRICED
- Comps
- 18 within 1.0 mi
Show comp detail 1 sale within ~0.75 mi
| Address | Dist | Beds/Ba | Sqft | Sold | Price | $/sf | Match |
|---|---|---|---|---|---|---|---|
| 106 Hesper Dr | 0.08mi | 3/3.0 | 1,837 (-7%) | 13mo | $369,000 | $201 | 70 |
Match score weights: distance 35% · size 25% · config 20% · recency 20%. Top-matched comps best support the ARV.
Projected returns pro-forma
-3.0% appreciation · 3.0% rent growth · sell at horizon
- IRR
- -18.7%
- Equity multiple
- 0.34×
- Total profit
- $-41,376
- Equity at exit
- $33,548
- IRR
- -11.3%
- Equity multiple
- 0.32×
- Total profit
- $-42,555
- Equity at exit
- $19,454
Cash invested: $63,000 (down + closing). Projections, not guarantees.
Landlord ↔ Tenant lean methodology
- Overall (STATE)
- 90 Strongly Landlord-Friendly
- State Louisiana
- 90 Strongly Landlord-Friendly · R+12
- County
- — inherits STATE
- City
- — inherits STATE
ZIP-level market 70520
- Home prices YoY
- -17.6%
- Active inventory
- 281
- Price-to-rent
- 11.2×
Monthly cashflow live
- Estimated rent
- $1,675 medium interval (Pro) →
- Mortgage (P&I)
- −$1,180
- Tax from tax record
- −$126 /mo · $1,509/yr
- Insurance
- −$94
- HOA
- −$0
- Vacancy / Maint / Mgmt
- −$352
- Net cashflow
- $-76
Break-even live
Sensitivity live
| Price | -10% $51 | -5% $-12 | +0% $-76 | +5% $-140 | +10% $-203 |
|---|---|---|---|---|---|
| Rent | -10% $-208 | -5% $-142 | +0% $-76 | +5% $-10 | +10% $56 |
| Rate | -1.0pp $37 | -0.5pp $-19 | base $-76 | +0.5pp $-134 | +1.0pp $-194 |
UW: 25.0% down · 7.5% · 30yr · 1.5% tax · 5.0% vac · 8.0% maint · 8.0% mgmt
Financing live
Cash to close
- Down payment
- $56,250
- Closing costs
- $6,750
- Reserves months
- —
- Total cash needed
- —
Loan-product check · same deal, 3 products live
Conventional
25% down · 7.5% · 30yr
- Down + closing
- —
- Monthly P&I
- —
- Monthly cashflow
- —
- DSCR
- —
- Eligible?
- —
Personal DTI + credit; lowest rate.
DSCR
20% down · 8.5% · 30yr
- Down + closing
- —
- Monthly P&I
- —
- Monthly cashflow
- —
- DSCR
- —
- Eligible?
- —
No personal income docs; deal must DSCR.
Hard money
10% down · 12.0% · 12mo
- Down + closing
- —
- Monthly P&I
- —
- Monthly cashflow
- —
- DSCR
- —
- Eligible?
- —
Short-term bridge; refi at stabilization.
Rent comps 2 comps
| Address | Beds | Baths | Sqft | Rent | $/sqft | DOM | Units | Dist |
|---|---|---|---|---|---|---|---|---|
| 124 Saint Fabian Dr Carencro, LA | 3.0 | 2.0 | 1450 | $1,700 | $1.17 | 45d | 1 | 1.27mi |
| 124 Saint Fabian Dr Carencro, LA | 3.0 | 2.0 | 1441 | $1,650 | $1.15 | 23d | 1 | 1.27mi |
Listing history 21 events
-
2026-06-21days on market $225,000 Active 44 DOM
-
2026-06-18days on market $225,000 Active 41 DOM
-
2026-06-17days on market $225,000 Active 40 DOM
-
2026-06-16days on market $225,000 Active 39 DOM
-
2026-06-15days on market $225,000 Active 38 DOM
-
2026-06-14days on market $225,000 Active 36 DOM
-
2026-06-13days on market $225,000 Active 35 DOM
-
2026-06-10days on market $225,000 Active 33 DOM
-
2026-06-09days on market $225,000 Active 32 DOM
-
2026-06-08days on market $225,000 Active 31 DOM
-
2026-06-07days on market $225,000 Active 30 DOM
-
2026-06-05days on market $225,000 Active 27 DOM
-
2026-06-03days on market $225,000 Active 26 DOM
-
2026-06-02days on market $225,000 Active 25 DOM
-
2026-06-01days on market $225,000 Active 24 DOM
-
2026-05-31days on market $225,000 Active 23 DOM
-
2026-05-30days on market $225,000 Active 22 DOM
-
2026-05-08$225,000 Active 569-char remark
-
2024-10-07price $232,000
-
2024-09-19price $237,000
-
2024-08-23$242,000 Active
ⓘ Source: listings_history table (triggers on properties + properties_extension) + one-shot
backfill from property_details.listing_events for pre-trigger history.
Tax reassessment forecast LA · Resets to sale price
- Current annual tax
- $1,509 · $126/mo
- Projected year-2 tax
- $1,509 · $126/mo
- Expected delta
- $0/yr ($0/mo · 0.0%)
ⓘ Screening estimate from a state-policy table — verify with the county assessor before closing.
Climate risk First Street
- Flood 1/10 Low FEMA zone X (unshaded) · 0% chance over 30 yrs
- Wildfire 2/10 Low
- Heat 8/10 Severe 7 d/yr ≥109°F today · 20 d/yr by 30 yrs out
- Wind 9/10 Extreme 99% chance of damaging wind over 30 yrs
- Air quality 2/10 Low 0 unhealthy d/yr today · 1 by 30 yrs out
Nearby sold comps map
Loading sold comps map…
Walkable amenities ~0.75 mi
Loading nearby amenities…
Taxation est. · year 1
- Rental income
- $20,101
- − Mortgage interest
- −$12,603
- − Property taxes
- −$1,509
- − Insurance
- −$1,125
- − Repairs & maintenance
- −$1,608
- − Management
- −$1,608
- − Depreciation
- −$6,545
- Taxable loss
- −$4,898
- Est. tax savings @ 24.0%
- +$1,175
- After-tax cash flow
- $262/yr
For passive investors: Depreciation is non-cash, so a rental often shows a tax loss while cash-flowing — sheltering income. Rental losses are passive: they offset passive income freely, and up to $25,000/yr can offset ordinary (W-2) income if you actively participate and your MAGI is under $100k (phasing out to $0 by $150k); unused losses carry forward. On sale, claimed depreciation is recaptured at up to 25%, and gains may owe capital-gains tax (a 1031 exchange can defer both). Figures are a year-1 estimate at your 24.0% rate — not tax advice; consult a CPA.
Schools (NCES district)
- District
- Lafayette Parish
- NCES district ID
- 2200870
- Math proficiency
- 38% ▼ -32.00%
- Reading proficiency
- 46% ▼ -24.00%
- Median HH income
- $50,238
- Composite
- 36.15/100
- National rank
- #4741
- State rank
- #19 of 98 in LA
Livability — Carencro
- Score
- 69/100
- State rank
- #65
- US rank
- #8277
Category grades
Schools grade is shown separately in the Schools card above.
Census & demographics
- City population
- 20,134
- Population (ZIP)
- 20,134
Population outlook (Lafayette County) Hauer SSP2
- Today (2025)
- 280,930 people
- By 2030
- 301,092 · +7.2%
- By 2040
- 339,456 · +20.8%
- By 2050
- 375,156 · +33.5%
- By 2075
- 451,672 · +60.8%
- By 2100
- 497,203 · +77.0%
Race, ethnicity, and origin ACS 2023
- Neighborhood character
- Diverse neighborhood (Simpson 0.56)
- Race & ethnicity
- White 58% Black 32% Two or more races 5% Hispanic / Latino 3% Asian 2%
- Common ancestry
- Lithuanian 13% Scotch-Irish 2% Italian 1%
- Foreign-born
- 2% · Canada
- Languages at home
- 92% English-only · French/Haitian/Cajun 5% Spanish 1% Other Indo-European 1%
Political lean MEDSL · Lafayette
- 2024 margin
- Solid R (+31.4) · D 33.5% · R 64.8% · Other 1.7%
- 2008→2024 swing
- -0.1pp no change · 2008: -31.3pp · 2024: -31.4pp
- All cycles
- 2024: R+31.4 2020: R+28.7 2016: R+33.6 2012: R+33.7 2008: R+31.3
Not yet ingested
- Civics
- —
Market trends
- HPI YoY
- ▼ -33.62%
- Current HPI
- 157.0194
- Rent YoY
- —
- Metro
- —
- State GDP YoY
- ▲ 3.29%
- F500 in state
- 10
Industry mix (Fortune 500 HQ in LA)
| Industry | F500 HQs | Revenue |
|---|---|---|
| Telecommunications | 2 | $23B |
|
||
| Utilities | 1 | $12B |
|
||
| Wholesale / Distribution | 1 | $5B |
|
||
| Advertising | 1 | $2B |
|
||
Price history
-7.0% since first listed4 events — show timeline
- 2026-05-08 Listed $225,000 AcadianaMLS
- 2024-10-07 Price Changed $232,000 NELABOR
- 2024-09-19 Price Changed $237,000 NELABOR
- 2024-08-23 Listed $242,000 NELABOR
Property tax history
+6.9%/yrLatest (2025): $1,509 · +9.7% YoY. Source: county tax records.
Cash-flow waterfall
monthlySold comps — $/sqft
last 12 mo · ≤1 miLoading sold comps…