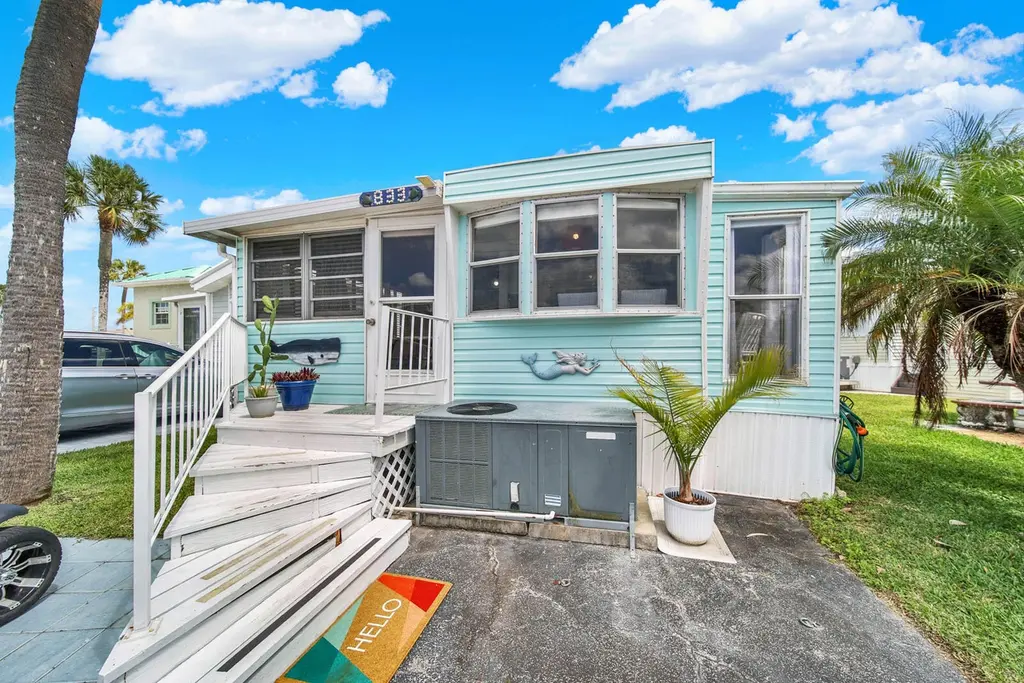
833 Nettles Blvd
Hutchinson Island South, FL 34957
$272,000F
2 bd · 1.0 ba ·
352 sqft ·
Built 1978
· Manufactured
· Active
· 52 DOM
Cashflow @ list (25.0% down · 7.5%)
Estimated rent
$1,902/mo
Mortgage (P&I)
−$1,426
Tax + insurance
−$479
HOA
−$420
Vac / Maint / Mgmt
−$400
Net cashflow
$-822/mo
Annual
$-9,864/yr
Cap rate
2.96%
Cash-on-cash
-11.91%
DSCR
0.47
1% rule
0.70%
Cash to close
$76,160
Investor read
- This is a 2-bed/1.0-bath manufactured listed at $272k.
- At list price, monthly cash flow is $-822 ($-10k/yr) — negative.
- To cash-flow at today's rent, offer at most $127k (53.4% below list).
- To meet the 1% rule (rent ≥ 1% of price), the offer needs to be $190k (30.1% below list).
- It's been on market 52 days — a 3% lower offer ($264k) is reasonable based on typical stale-listing flexibility.
- Recommended offer: $127k (53.4% below list) — sets the bar for cash-flow.
- Local home prices are declining (-3.0%/yr); year-one equity from $2k of loan paydown is wiped out by about $8k of value loss. Plan a longer hold.
- Location reads 61/100 on livability (#783 in FL) — a middle-class / working-renter tenant base. Strengths: crime A+, housing B; Watch: cost of living C-, schools D, amenities F.
- St. Lucie (urban): math 40% / reading 48% proficiency, ranked #51 of 73 in FL (top 70%) — families likely to look elsewhere, expect single-tenant / working-renter base with shorter leases.
- Watch-outs: flood insurance adds $66/mo; HOA is 22% of rent.
- Market conditions: Rents rising (+1.0%/yr); 536 active listings in the ZIP; 4,868 units permitted in St. Lucie County in 2024 (268 in 5+ unit buildings).
- St. Lucie County population projected at +20% by 2050 — long-run rental-demand tailwind backs the buy-and-hold thesis.
- 5 sale attempts since 13y ago with the ask held roughly flat each time — persistent listings suggest the price (not the market) is what's stuck; bring a comps-based counter.
- Current owner paid $215k; 27% above their basis — modest negotiation headroom, anchor on the comps not their cost.
- Climate carrying-cost: severe flood risk; severe wind risk, 99% chance of damaging wind over 30y; extreme-heat days projected 7→24/yr by 2055 (HVAC capex compounding) — expect insurance premiums to compound above CPI over the hold.
- Cap rate 3.0% vs local median 1.9% in Hutchinson Island South — top-decile yield for the area; either an underpriced asset or a hidden risk that comps aren't pricing in. Stress-test before assuming the spread holds.
- This rent runs 32% of the median local income ($70k/yr) — at the standard rent-burdened threshold; future hikes will face affordability resistance.
Questions for listing agent
- What do current leases actually rent for vs. the listed asking? Can we see a recent rent roll and the last 12 months of T-12 income?
- It's been on market 52 days. Have you received any prior offers? Is the seller open to a 53% concession, seller financing, or rate buy-down credit?
- Built in 1978 — when were the roof, HVAC, electrical panel, plumbing, and water heater last replaced?
- What's the actual annual flood-insurance premium (NFIP or private), and is the property in a SFHA with mandatory coverage?
- What does the HOA fee cover, when was the last increase, and are there any pending special assessments or reserve-fund shortfalls?
- Is there a deadline driving the sale (1031 exchange, divorce, estate, relocation)? That informs how much negotiation room exists.
- Schools are D-rated, which usually means shorter tenancies and higher turnover. Who's the typical renter profile here, and what's been the actual vacancy rate?
- The area grade is low — what's the realistic commute time and amenity access for the typical tenant pool here? Any planned neighborhood developments (good or bad) we should know about?
CashFlowRE · CFR-GQVTCP12M35F40
· Data 2 days ago
cashflowre.app · 2026-05-29