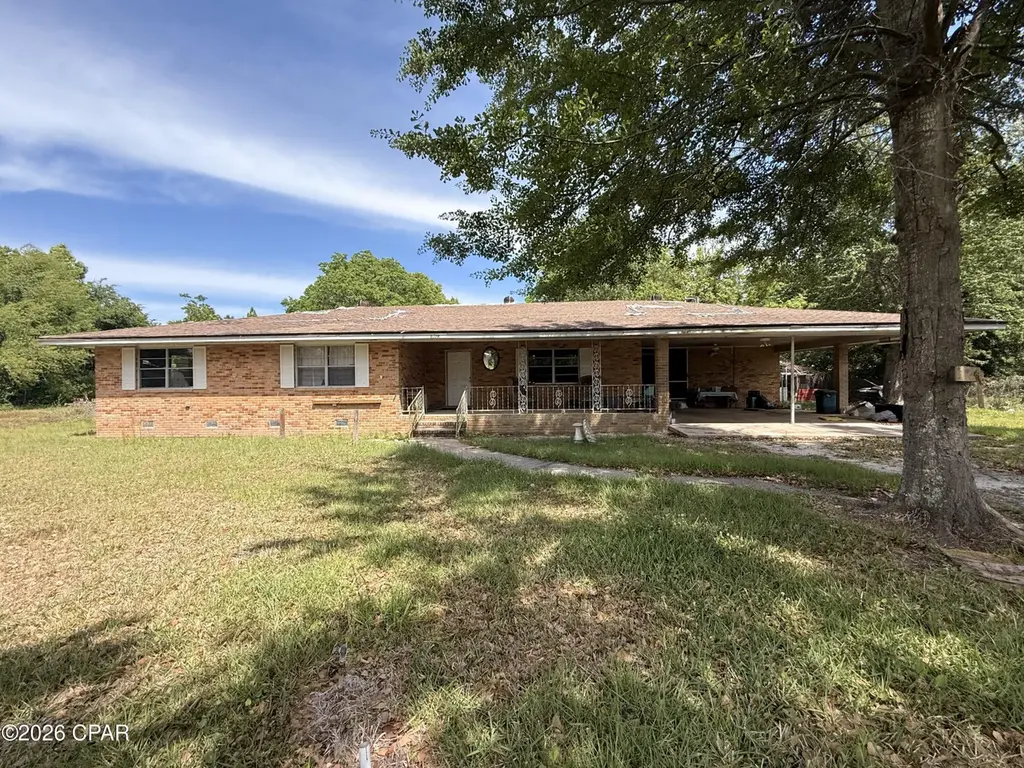
6714 Sunburst Ln
Lynn Haven, FL 32409
$175,000B
3 bd · 2.0 ba ·
1,875 sqft ·
Built 1968
· SingleFamily
· Active
· 52 DOM
Cashflow @ list (25.0% down · 7.5%)
Estimated rent
$1,785/mo
Mortgage (P&I)
−$918
Tax + insurance
−$287
HOA
−$0
Vac / Maint / Mgmt
−$375
Net cashflow
$206/mo
Annual
$2,469/yr
Cap rate
8.16%
Cash-on-cash
6.67%
DSCR
1.30
1% rule
1.02%
Cash to close
$49,000
Investor read
- This is a 3-bed/2.0-bath single-family listed at $175k.
- At list price, monthly cash flow is $206 ($2k/yr) — positive.
- The deal already cash-flows at list — no discount required.
- Meets the 1% rule at list price ($2k rent vs $175k).
- It's been on market 52 days — a 3% lower offer ($170k) is reasonable based on typical stale-listing flexibility.
- Recommended offer: $170k (3.0% below list) — sets the bar for market timing.
- In year one you build about $17k of equity ($1k loan paydown + $16k appreciation (9.1% local appreciation)).
- Location reads 81/100 on livability (#96 in FL, #1,472 nationally) — a professional / high-income tenant draw. Strengths: crime A+, housing A+, health & safety A+; Watch: amenities D+, commute F.
- Bay (suburban): math 51% / reading 51% proficiency, ranked #29 of 73 in FL (top 40%) — acceptable for families but not a draw, mixed tenant base, ~2y average lease.
- Watch-outs: flood insurance adds $66/mo.
- Market conditions: 299 active listings in the ZIP; 1 comparable units currently listed for rent nearby; 2,473 units permitted in Bay County in 2024 (559 in 5+ unit buildings).
- Bay County population projected at +24% by 2050 — long-run rental-demand tailwind backs the buy-and-hold thesis.
- Current owner paid $150k; 17% above their basis — modest negotiation headroom, anchor on the comps not their cost.
- At projected returns (9.1% appreciation + 3.0% rent growth), your $49k cash investment doubles in ~3 years — after that, you're playing with house money.
- By year 3, paydown + projected appreciation supports a ~$43k cash-out refi (75% LTV) — recoverable capital for the next deal without selling this one.
- Climate carrying-cost: severe flood risk; severe wind risk, 99% chance of damaging wind over 30y; moderate wildfire risk; extreme-heat days projected 7→21/yr by 2055 (HVAC capex compounding) — expect insurance premiums to compound above CPI over the hold.
- Cap rate 8.2% vs local median 3.5% in Lynn Haven — top-decile yield for the area; either an underpriced asset or a hidden risk that comps aren't pricing in. Stress-test before assuming the spread holds.
Questions for listing agent
- It's been on market 52 days. Have you received any prior offers? Is the seller open to a 3% concession, seller financing, or rate buy-down credit?
- Built in 1968 — when were the roof, HVAC, electrical panel, plumbing, and water heater last replaced?
- What's the actual annual flood-insurance premium (NFIP or private), and is the property in a SFHA with mandatory coverage?
- Is there a deadline driving the sale (1031 exchange, divorce, estate, relocation)? That informs how much negotiation room exists.
- Schools are B-rated — typically a magnet for longer-tenancy family renters. What's the average tenant stay here, and is there a school-zone premium baked into asking?
- What's the average days-on-market for RENTAL listings here right now (not sales)? A rising rental-DOM trend means longer vacancies and softer asking-rent achievability than the comps imply.
- What's the recent tenant-quality profile in this submarket — average credit score on applications, eviction rate, late-payment / NSF rate, and stable-employment percentage? A property-management company in the area should have these aggregated.
- How much new for-sale + rental construction is in the pipeline within 1–3 miles? Heavy new supply typically softens prices + rents 12–24 months out; constrained supply supports both.
CashFlowRE · CFR-GW012DATDB0P9K
· Data 4 days ago
cashflowre.app · 2026-05-29