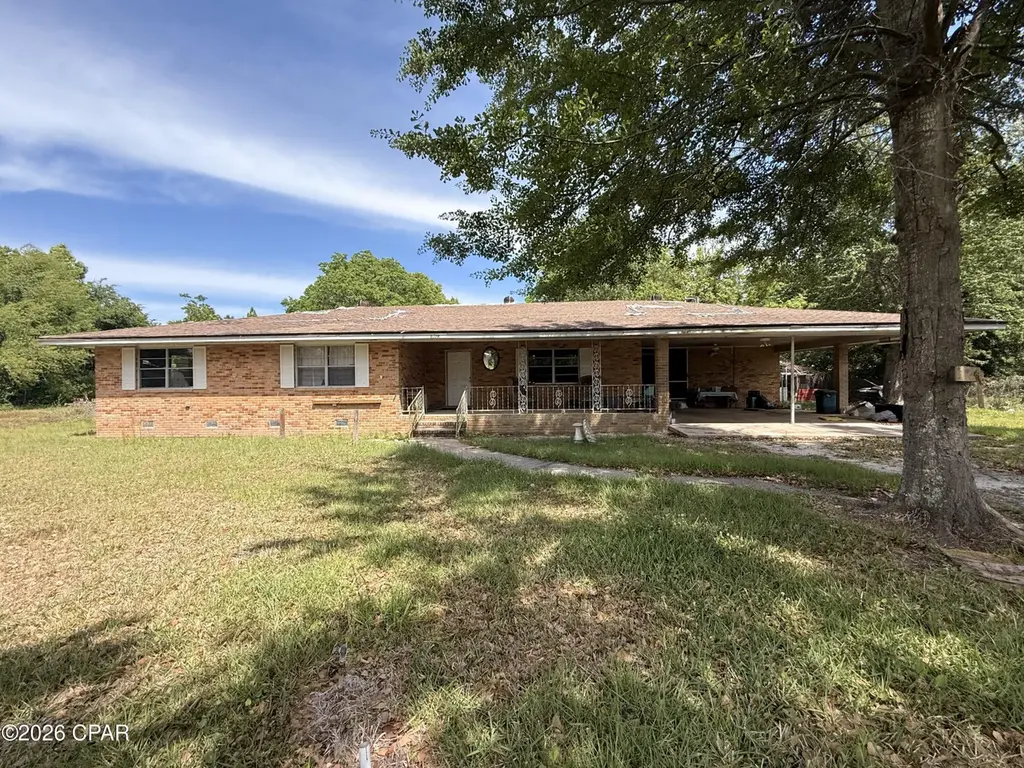
6714 Sunburst Ln · Lynn Haven, FL
Flood risk 8/10 · Major
- FEMA flood zone
- X (shaded)
- Chance of flooding over 30 yrs
- 0.96%
- Est. flood insurance / yr
- $507 – $1,088
Fire risk 5/10 · Moderate
- Est. fire insurance / yr
- $947 – $1,759
Heat risk 10/10 · Severe
- Hot days now (above 105°F)
- 7 days/yr
- Hot days in 30 yrs
- 21 days/yr
Wind risk 9/10 · Severe
- Chance of severe wind over 30 yrs
- 99.0%
Air-quality risk 1/10 · Minimal
- Unhealthy air days now
- 0 days/yr
- Unhealthy air days in 30 yrs
- 0 days/yr
Risk factors via First Street. Map © Google.
Why this score? — see what drove the B grade
The composite is a weighted blend of 9 inputs, each scored 0–100. Each bar is that input's sub-score; the figure is the points it added to the 100-point composite (weight × sub-score).
- Cash flow +21.8/30.0
- ARV discount +15.0/15.0
- Appreciation +9.5/10.0
- DSCR +7.0/10.0
- 1% rule +5.2/10.0
- Schools +4.3/10.0
- Livability +4.0/5.0
- Rent growth +2.5/5.0
- Condition / age +2.5/5.0
$175,000
🖨 Deal sheet 📄 Offer letter ✓ Due diligence
Listing remarks
Investor Special - Endless Potential on Nearly Half an Acre! Located at 6714 Sunburst Lane in Southport, just outside of town in a quiet, peaceful setting, this nearly 1,900 sq ft all-brick home sits on an expansive lot just under half an acre with no HOA. This property offers a fantastic opportunity for investors, flippers, or buyers looking to renovate and create their own vision. With solid brick construction and a desirable location, the potential here is undeniable. Important: The home is in poor condition and will require significant repairs and renovation. Portions of the flooring are soft and unstable--use extreme caution when entering the property. Entry is at your own risk. Utili
Key facts
- Desirable location
- Half an acre
- 0.48 acre lot
Tags
Property features AI
Finance
- Other: Units partially furnished (multi-unit information)
- HOA & community: Short-term rentals allowed
Exterior
- Parking: 2 covered parking spaces
- Home design: Single-story home
- Construction: Mobile dimension units listed in feet
- Exterior features: Lot approximately 0.48 acres; Lot dimensions 145 x 145; Zoned for single-family residential
Interior
- Kitchen: Kitchen (first floor)
- Bathrooms: 2 full bathrooms
- Interior features: Dining room; Great room; Kitchen
Neighborhood map
What this means for you Summary
Snapshot
- This is a 3-bed/2.0-bath single-family listed at $175k.
Deal economics
- At list price, monthly cash flow is $206 ($2k/yr) — positive.
- The deal already cash-flows at list — no discount required.
- Meets the 1% rule at list price ($2k rent vs $175k).
- Recommended offer: $170k (3.0% below list) — sets the bar for market timing.
- Cap rate 8.2% vs local median 3.5% in Lynn Haven — top-decile yield for the area; either an underpriced asset or a hidden risk that comps aren't pricing in. Stress-test before assuming the spread holds.
Location & tenants
- Location reads 81/100 on livability (#96 in FL, #1,472 nationally) — a professional / high-income tenant draw. Strengths: crime A+, housing A+, health & safety A+; Watch: amenities D+, commute F.
- Bay (suburban): math 51% / reading 51% proficiency, ranked #29 of 73 in FL (top 40%) — acceptable for families but not a draw, mixed tenant base, ~2y average lease.
- Market conditions: 299 active listings in the ZIP; 1 comparable units currently listed for rent nearby; 2,473 units permitted in Bay County in 2024 (559 in 5+ unit buildings).
Forward outlook
- In year one you build about $17k of equity ($1k loan paydown + $16k appreciation (9.1% local appreciation)).
- Bay County population projected at +24% by 2050 — long-run rental-demand tailwind backs the buy-and-hold thesis.
- At projected returns (9.1% appreciation + 3.0% rent growth), your $49k cash investment doubles in ~3 years — after that, you're playing with house money.
- By year 3, paydown + projected appreciation supports a ~$43k cash-out refi (75% LTV) — recoverable capital for the next deal without selling this one.
Negotiation context
- It's been on market 52 days — a 3% lower offer ($170k) is reasonable based on typical stale-listing flexibility.
- Current owner paid $150k; 17% above their basis — modest negotiation headroom, anchor on the comps not their cost.
Risks & watch-outs
- Watch-outs: flood insurance adds $66/mo.
- Climate carrying-cost: severe flood risk; severe wind risk, 99% chance of damaging wind over 30y; moderate wildfire risk; extreme-heat days projected 7→21/yr by 2055 (HVAC capex compounding) — expect insurance premiums to compound above CPI over the hold.
Questions for the listing agent
- It's been on market 52 days. Have you received any prior offers? Is the seller open to a 3% concession, seller financing, or rate buy-down credit?
- Built in 1968 — when were the roof, HVAC, electrical panel, plumbing, and water heater last replaced?
- What's the actual annual flood-insurance premium (NFIP or private), and is the property in a SFHA with mandatory coverage?
- Is there a deadline driving the sale (1031 exchange, divorce, estate, relocation)? That informs how much negotiation room exists.
- Schools are B-rated — typically a magnet for longer-tenancy family renters. What's the average tenant stay here, and is there a school-zone premium baked into asking?
- What's the average days-on-market for RENTAL listings here right now (not sales)? A rising rental-DOM trend means longer vacancies and softer asking-rent achievability than the comps imply.
- What's the recent tenant-quality profile in this submarket — average credit score on applications, eviction rate, late-payment / NSF rate, and stable-employment percentage? A property-management company in the area should have these aggregated.
- How much new for-sale + rental construction is in the pipeline within 1–3 miles? Heavy new supply typically softens prices + rents 12–24 months out; constrained supply supports both.
Investment metrics
- 1% rule
- 1.02% ✓
- Cap rate
- 8.16%
- Cash-on-cash
- 6.67%
- DSCR
- 1.30
- GRM
- 8.2
CMA / ARV
- ARV (median comp)
- $297,392
- List price
- $175,000
- Delta
- -41.16%
- Verdict
- UNDERPRICED
- Comps
- 13 within 1.0 mi
Projected returns pro-forma
9.08% appreciation · 3.0% rent growth · sell at horizon
- IRR
- 26.1%
- Equity multiple
- 2.99×
- Total profit
- $97,540
- Equity at exit
- $146,063
- IRR
- 23.1%
- Equity multiple
- 6.61×
- Total profit
- $274,697
- Equity at exit
- $303,421
Cash invested: $49,000 (down + closing). Projections, not guarantees.
Landlord ↔ Tenant lean methodology
- Overall (STATE)
- 87 Strongly Landlord-Friendly
- State Florida
- 87 Strongly Landlord-Friendly · R+3
- County
- — inherits STATE
- City
- — inherits STATE
ZIP-level market 32409
- Home prices YoY
- 2.4%
- Active inventory
- 299
- Price-to-rent
- 8.2×
Monthly cashflow live
- Estimated rent
- $1,785 medium interval (Pro) →
- Mortgage (P&I)
- −$918
- Tax from tax record
- −$147 /mo · $1,768/yr
- Insurance
- −$73
- Flood insurance flood zone
- −$66 /mo · $798/yr
- HOA
- −$0
- Vacancy / Maint / Mgmt
- −$375
- Net cashflow
- $206
Break-even live
UW: 25.0% down · 7.5% · 30yr · 1.5% tax · 5.0% vac · 8.0% maint · 8.0% mgmt
Financing live
Cash to close
- Down payment
- $43,750
- Closing costs
- $5,250
- Reserves months
- —
- Total cash needed
- —
Loan-product check · same deal, 3 products live
Conventional
25% down · 7.5% · 30yr
- Down + closing
- —
- Monthly P&I
- —
- Monthly cashflow
- —
- DSCR
- —
- Eligible?
- —
Personal DTI + credit; lowest rate.
DSCR
20% down · 8.5% · 30yr
- Down + closing
- —
- Monthly P&I
- —
- Monthly cashflow
- —
- DSCR
- —
- Eligible?
- —
No personal income docs; deal must DSCR.
Hard money
10% down · 12.0% · 12mo
- Down + closing
- —
- Monthly P&I
- —
- Monthly cashflow
- —
- DSCR
- —
- Eligible?
- —
Short-term bridge; refi at stabilization.
Rent comps 1 comps
| Address | Beds | Baths | Sqft | Rent | $/sqft | DOM | Units | Dist |
|---|---|---|---|---|---|---|---|---|
| 1105 13th St Panama City, FL | 3.0 | 2.0 | 1350 | $1,785 | $1.32 | 21d | 1 | 1.20mi |
Listing history 17 events
-
2026-06-16days on market $175,000 Active 52 DOM
-
2026-06-15days on market $175,000 Active 51 DOM
-
2026-06-14days on market $175,000 Active 49 DOM
-
2026-06-13days on market $175,000 Active 48 DOM
-
2026-06-10days on market $175,000 Active 46 DOM
-
2026-06-09days on market $175,000 Active 45 DOM
-
2026-06-08days on market $175,000 Active 44 DOM
-
2026-06-07days on market $175,000 Active 43 DOM
-
2026-06-05days on market $175,000 Active 40 DOM
-
2026-06-03days on market $175,000 Active 39 DOM
-
2026-06-02days on market $175,000 Active 38 DOM
-
2026-06-01days on market $175,000 Active 37 DOM
-
2026-05-31days on market $175,000 Active 36 DOM
-
2026-05-30days on market $175,000 Active 35 DOM
-
2026-05-08price $185,000 998-char remark
-
2026-04-25$195,000 Active 998-char remark
-
2005-12-07soldstatus $150,000
ⓘ Source: listings_history table (triggers on properties + properties_extension) + one-shot
backfill from property_details.listing_events for pre-trigger history.
Tax reassessment forecast FL · Resets to sale price
- Current annual tax
- $1,768 · $147/mo
- Projected year-2 tax
- $1,768 · $147/mo
- Expected delta
- $0/yr ($0/mo · 0.0%)
ⓘ Screening estimate from a state-policy table — verify with the county assessor before closing.
Climate risk First Street
- Flood 8/10 Severe FEMA zone X (shaded) · 96% chance over 30 yrs
- Wildfire 5/10 Major
- Heat 10/10 Extreme 7 d/yr ≥105°F today · 21 d/yr by 30 yrs out
- Wind 9/10 Extreme 99% chance of damaging wind over 30 yrs
- Air quality 1/10 Low 0 unhealthy d/yr today · 0 by 30 yrs out
Nearby sold comps map
Loading sold comps map…
Walkable amenities ~0.75 mi
Loading nearby amenities…
Taxation est. · year 1
- Rental income
- $21,420
- − Mortgage interest
- −$9,803
- − Property taxes
- −$1,768
- − Insurance
- −$1,672
- − Repairs & maintenance
- −$1,714
- − Management
- −$1,714
- − Depreciation
- −$5,091
- Taxable loss
- −$341
- Est. tax savings @ 24.0%
- +$82
- After-tax cash flow
- $2,551/yr
For passive investors: Depreciation is non-cash, so a rental often shows a tax loss while cash-flowing — sheltering income. Rental losses are passive: they offset passive income freely, and up to $25,000/yr can offset ordinary (W-2) income if you actively participate and your MAGI is under $100k (phasing out to $0 by $150k); unused losses carry forward. On sale, claimed depreciation is recaptured at up to 25%, and gains may owe capital-gains tax (a 1031 exchange can defer both). Figures are a year-1 estimate at your 24.0% rate — not tax advice; consult a CPA.
Schools (NCES district)
- District
- Bay
- NCES district ID
- 1200090
- Math proficiency
- 51% ▼ -8.00%
- Reading proficiency
- 51% ▼ -7.00%
- Median HH income
- $47,740
- Composite
- 43.41/100
- National rank
- #3014
- State rank
- #29 of 73 in FL
Livability — Lynn Haven
- Score
- 81/100
- State rank
- #96
- US rank
- #1472
Category grades
Schools grade is shown separately in the Schools card above.
Census & demographics
- City population
- 21,459
- Population (ZIP)
- 10,941
Population outlook (Bay County) Hauer SSP2
- Today (2025)
- 206,264 people
- By 2030
- 217,740 · +5.6%
- By 2040
- 238,738 · +15.7%
- By 2050
- 255,545 · +23.9%
- By 2075
- 288,295 · +39.8%
- By 2100
- 288,638 · +39.9%
Race, ethnicity, and origin ACS 2023
- Neighborhood character
- Predominantly White (88%)
- Race & ethnicity
- White 88% Hispanic / Latino 7% Two or more races 4% Asian 1%
- Hispanic origin (detail)
- Mexican 3% Puerto Rican 2%
- Common ancestry
- Lithuanian 4% Slovak 3% Serbian 2%
- Foreign-born
- 4% · Canada, Jamaica, South Korea
- Languages at home
- 94% English-only · Spanish 4% Other Indo-European 1%
Political lean MEDSL · Bay
- 2024 margin
- Solid R (+47.4) · D 25.8% · R 73.1% · Other 1.1%
- 2008→2024 swing
- -6.6pp toward R · 2008: -40.7pp · 2024: -47.4pp
- All cycles
- 2024: R+47.4 2020: R+43.5 2016: R+46.3 2012: R+43.6 2008: R+40.7
Not yet ingested
- Civics
- —
Market trends
- HPI YoY
- ▲ 9.08%
- Current HPI
- 391.06
- Rent YoY
- —
- Metro
- —
- State GDP YoY
- ▲ 3.28%
- F500 in state
- 36
Industry mix (Fortune 500 HQ in FL)
| Industry | F500 HQs | Revenue |
|---|---|---|
| Industrial Technology | 2 | $29B |
|
||
| Insurance | 2 | $17B |
|
||
| Retail | 1 | $60B |
|
||
| Technology Distribution | 1 | $58B |
|
||
| Homebuilding | 1 | $35B |
|
||
| Technology Manufacturing | 1 | $35B |
|
||
Price history
+16.7% since first listed4 events — show timeline
- 2026-05-19 Price Changed $175,000 CPARMLS
- 2026-05-08 Price Changed $185,000 CPARMLS
- 2026-04-25 Listed $195,000 CPARMLS
- 2005-12-07 Sold (Public Records) $150,000 Public Records
Property tax history
-0.1%/yrLatest (2025): $1,768 · +7.8% YoY. Source: county tax records.
Cash-flow waterfall
monthlySold comps — $/sqft
last 12 mo · ≤1 miLoading sold comps…