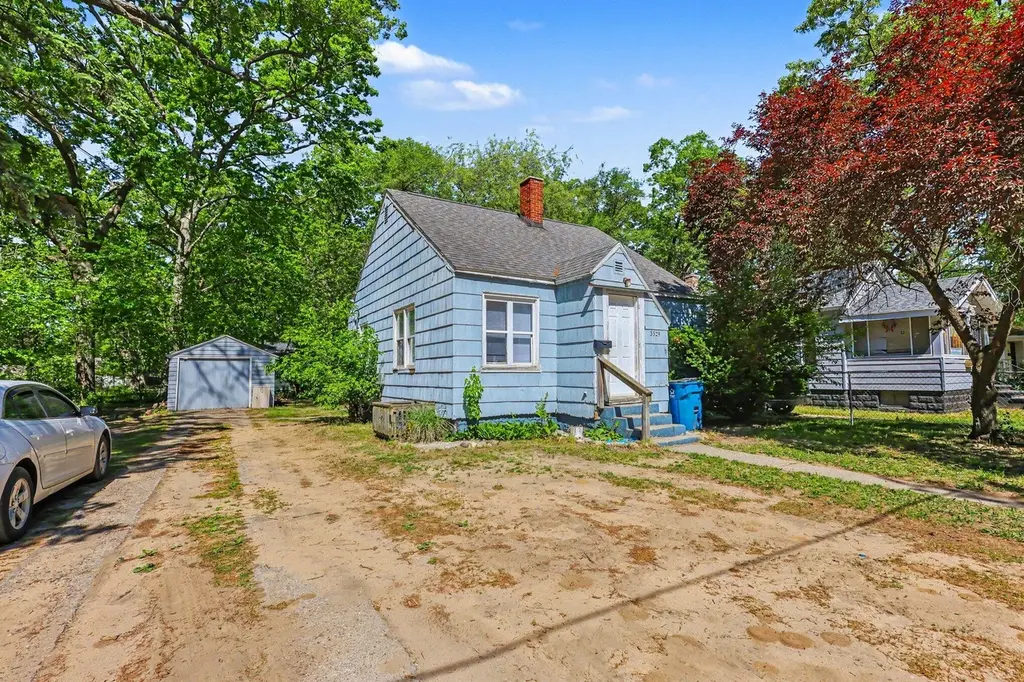
3329 Sanford St
Muskegon Heights, MI 49444
$114,900F
2 bd · 1.0 ba ·
672 sqft ·
Built 1953
· SingleFamily
· Active
· 16 DOM
Cashflow @ list (25.0% down · 7.5%)
Estimated rent
$830/mo
Mortgage (P&I)
−$603
Tax + insurance
−$180
HOA
−$0
Vac / Maint / Mgmt
−$174
Net cashflow
$-127/mo
Annual
$-1,518/yr
Cap rate
4.97%
Cash-on-cash
-4.72%
DSCR
0.79
1% rule
0.72%
Cash to close
$32,172
Investor read
- This is a 2-bed/1.0-bath single-family listed at $115k.
- At list price, monthly cash flow is $-127 ($-2k/yr) — negative.
- To cash-flow at today's rent, offer at most $93k (19.5% below list).
- To meet the 1% rule (rent ≥ 1% of price), the offer needs to be $83k (27.7% below list).
- It's been on market 16 days — a 2% lower offer ($113k) is reasonable based on typical stale-listing flexibility.
- Recommended offer: $83k (27.7% below list) — sets the bar for 1% rule.
- Local home prices are declining (-3.0%/yr); year-one equity from $794 of loan paydown is wiped out by about $3k of value loss. Plan a longer hold.
- Location reads 61/100 on livability (#574 in MI) — a middle-class / working-renter tenant base. Strengths: cost of living A+, housing A; Watch: schools D+, crime F, amenities F.
- Watch-outs: built in 1953 — expect roof / HVAC / electrical / plumbing capex.
- Market conditions: 237 active listings in the ZIP; 3 comparable units currently listed for rent nearby; rentals at typical pace (median 22d on market — plan ~3-4 weeks tenant-placement turnaround); 438 units permitted in Muskegon County in 2024 (115 in 5+ unit buildings).
- Muskegon County population projected to shrink 8% by 2050 — rents likely to lag national; underwrite the cash flow, not the appreciation.
- 15 sale attempts since 13y ago with the ask held roughly flat each time — persistent listings suggest the price (not the market) is what's stuck; bring a comps-based counter.
- Climate carrying-cost: major flood risk — expect insurance premiums to compound above CPI over the hold.
- Cap rate 5.0% vs local median 8.4% in Muskegon Heights — below-typical yield; the buyer is paying a premium for something (appreciation thesis, condition, location) that the cap rate doesn't capture.
Questions for listing agent
- What do current leases actually rent for vs. the listed asking? Can we see a recent rent roll and the last 12 months of T-12 income?
- Built in 1953 — when were the roof, HVAC, electrical panel, plumbing, and water heater last replaced?
- Is there a deadline driving the sale (1031 exchange, divorce, estate, relocation)? That informs how much negotiation room exists.
- Schools are D-rated, which usually means shorter tenancies and higher turnover. Who's the typical renter profile here, and what's been the actual vacancy rate?
- Crime grade is F in this area — have there been break-ins, vandalism, or insurance claims at this property in the last 3 years? What carrier currently insures it and at what premium?
- The area grade is low — what's the realistic commute time and amenity access for the typical tenant pool here? Any planned neighborhood developments (good or bad) we should know about?
- What's the average days-on-market for RENTAL listings here right now (not sales)? A rising rental-DOM trend means longer vacancies and softer asking-rent achievability than the comps imply.
- What's the recent tenant-quality profile in this submarket — average credit score on applications, eviction rate, late-payment / NSF rate, and stable-employment percentage? A property-management company in the area should have these aggregated.
CashFlowRE · CFR-GWN4VVBTX8FT3A
· Data 1 day ago
cashflowre.app · 2026-05-29