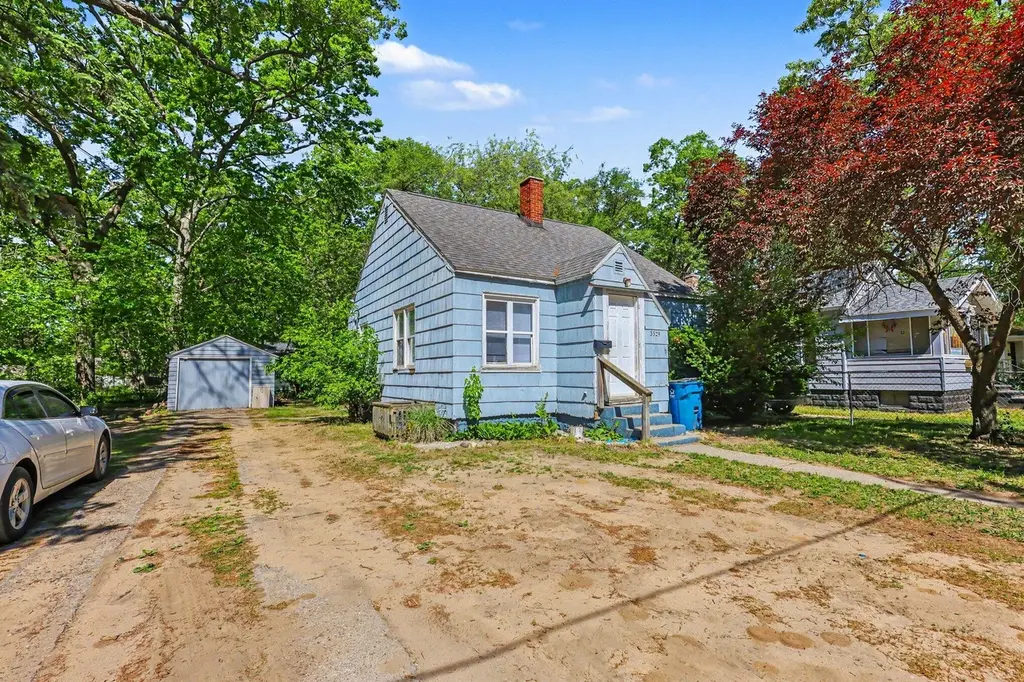
3329 Sanford St · Muskegon Heights, MI
Flood risk 6/10 · Moderate
- FEMA flood zone
- X (unshaded)
- Chance of flooding over 30 yrs
- 0.7%
- Est. flood insurance / yr
- $473 – $860
Fire risk 1/10 · Minimal
- Est. fire insurance / yr
- $784 – $1,456
Heat risk 1/10 · Minimal
- Hot days now (above 93°F)
- 7 days/yr
- Hot days in 30 yrs
- 15 days/yr
Wind risk 1/10 · Minimal
- Chance of severe wind over 30 yrs
- —
Air-quality risk 4/10 · Minor
- Unhealthy air days now
- 4 days/yr
- Unhealthy air days in 30 yrs
- 6 days/yr
Risk factors via First Street. Map © Google.
Why this score? — see what drove the F grade
The composite is a weighted blend of 9 inputs, each scored 0–100. Each bar is that input's sub-score; the figure is the points it added to the 100-point composite (weight × sub-score).
- Cash flow +7.8/30.0
- Schools +5.0/10.0
- Livability +3.1/5.0
- Rent growth +2.5/5.0
- Condition / age +2.5/5.0
- 1% rule +2.2/10.0
- DSCR +1.9/10.0
- ARV discount +0.0/15.0
- Appreciation +0.0/10.0
$114,900
🖨 Deal sheet 📄 Offer letter ✓ Due diligence
Listing remarks MLS
Move right into this affordable and updated 3 bedroom, 1.5 bathroom home in Muskegon Heights! Beautiful refinished hardwood floors run throughout the spacious living room and bedrooms, while updated luxury vinyl plank flooring adds a fresh, modern touch to the kitchen and bathroom. Additional features include a full basement offering plenty of storage space or potential for future finished living area, a detached garage, driveway parking, and a partially fenced backyard. Immediate possession is available at closing. Whether you're a first-time buyer, looking to downsize, or searching for an investment opportunity, this well-maintained home is ready for its next owner. The kitchen stove and refrigerator are included, and recent updates such as a newer furnace, newer water heater, and a solid roof provide added peace of mind.
Key facts
- Newer furnace
- Full basement
- Detached garage
Tags
Property features AI
Exterior
- Parking: Detached garage (1 car)
- Utilities: Public water; Natural gas available and connected; Electricity available; Cable connected; High-speed internet
- Home design: Cape Cod-style single family residence; Residential property; One-story (living area listed separately)
- Construction: Built in 1953; Vinyl siding; Shingle roof; Full foundation
- Exterior features: Paved road access; Lot of approximately 0.18 acres
Interior
- Kitchen: Range; Refrigerator
- Bedrooms: Cape Cod layout (bedroom count not specified)
- Bathrooms: 1 full bathroom; 1 half bathroom
- Heating & cooling: Forced air heating
- Interior features: 5 total rooms; Full basement
- Laundry & utility: Natural gas water heater
Neighborhood map
What this means for you Summary
Snapshot
- This is a 2-bed/1.0-bath single-family listed at $115k.
Deal economics
- At list price, monthly cash flow is $-127 ($-2k/yr) — negative.
- To cash-flow at today's rent, offer at most $93k (19.5% below list).
- To meet the 1% rule (rent ≥ 1% of price), the offer needs to be $83k (27.7% below list).
- Recommended offer: $83k (27.7% below list) — sets the bar for 1% rule.
- Cap rate 5.0% vs local median 8.4% in Muskegon Heights — below-typical yield; the buyer is paying a premium for something (appreciation thesis, condition, location) that the cap rate doesn't capture.
Location & tenants
- Location reads 61/100 on livability (#574 in MI) — a middle-class / working-renter tenant base. Strengths: cost of living A+, housing A; Watch: schools D+, crime F, amenities F.
- Market conditions: 237 active listings in the ZIP; 3 comparable units currently listed for rent nearby; rentals at typical pace (median 21d on market — plan ~3-4 weeks tenant-placement turnaround); 438 units permitted in Muskegon County in 2024 (115 in 5+ unit buildings).
Forward outlook
- Local home prices are declining (-3.0%/yr); year-one equity from $794 of loan paydown is wiped out by about $3k of value loss. Plan a longer hold.
- Muskegon County population projected to shrink 8% by 2050 — rents likely to lag national; underwrite the cash flow, not the appreciation.
Negotiation context
- It's been on market 16 days — a 2% lower offer ($113k) is reasonable based on typical stale-listing flexibility.
- 15 sale attempts since 13y ago with the ask held roughly flat each time — persistent listings suggest the price (not the market) is what's stuck; bring a comps-based counter.
Risks & watch-outs
- Watch-outs: built in 1953 — expect roof / HVAC / electrical / plumbing capex.
- Climate carrying-cost: major flood risk — expect insurance premiums to compound above CPI over the hold.
Questions for the listing agent
- What do current leases actually rent for vs. the listed asking? Can we see a recent rent roll and the last 12 months of T-12 income?
- Built in 1953 — when were the roof, HVAC, electrical panel, plumbing, and water heater last replaced?
- Is there a deadline driving the sale (1031 exchange, divorce, estate, relocation)? That informs how much negotiation room exists.
- Schools are D-rated, which usually means shorter tenancies and higher turnover. Who's the typical renter profile here, and what's been the actual vacancy rate?
- Crime grade is F in this area — have there been break-ins, vandalism, or insurance claims at this property in the last 3 years? What carrier currently insures it and at what premium?
- The area grade is low — what's the realistic commute time and amenity access for the typical tenant pool here? Any planned neighborhood developments (good or bad) we should know about?
- What's the average days-on-market for RENTAL listings here right now (not sales)? A rising rental-DOM trend means longer vacancies and softer asking-rent achievability than the comps imply.
- What's the recent tenant-quality profile in this submarket — average credit score on applications, eviction rate, late-payment / NSF rate, and stable-employment percentage? A property-management company in the area should have these aggregated.
- How much new for-sale + rental construction is in the pipeline within 1–3 miles? Heavy new supply typically softens prices + rents 12–24 months out; constrained supply supports both.
Investment metrics
- 1% rule
- 0.72% ✗
- Cap rate
- 4.97%
- Cash-on-cash
- -4.72%
- DSCR
- 0.79
- GRM
- 11.5
CMA / ARV
- ARV (on-the-fly)
- $78,624
- Comps found
- 12
Show comp detail 12 sales within ~0.75 mi
| Address | Dist | Beds/Ba | Sqft | Sold | Price | $/sf | Match |
|---|---|---|---|---|---|---|---|
| 3300 5th St | 0.14mi | 2/1.0 | 704 (+5%) | 8mo | $59,500 | $85 | 79 |
| 3133 Sanford St | 0.19mi | 2/1.0 | 724 (+8%) | 2mo | $50,000 | $69 | 76 |
| 3364 7th St | 0.23mi | 1/1.0 (-1) | 660 (-2%) | 9mo | $39,900 | $60 | 74 |
| 3229 Jefferson St | 0.11mi | 3/1.0 (+1) | 732 (+9%) | 2mo | $114,000 | $156 | 73 |
| 3212 5th St | 0.18mi | 2/1.0 | 624 (-7%) | 14mo | $68,000 | $109 | 68 |
| 3033 Morton Ave | 0.48mi | 2/1.0 | 688 (+2%) | 7mo | $97,000 | $141 | 68 |
| 3140 Temple St | 0.56mi | 2/1.0 | 690 (+3%) | 12mo | $90,000 | $130 | 59 |
| 2817 Mason Blvd | 0.65mi | 2/1.0 | 624 (-7%) | 1mo | $54,900 | $88 | 57 |
| 3304 Waalkes St | 0.49mi | 2/1.0 | 760 (+13%) | 0mo | $115,900 | $153 | 55 |
| 224 E Lincoln Ave | 0.45mi | 3/1.0 (+1) | 770 (+15%) | 2mo | $90,000 | $117 | 48 |
| 142 Harrison Blvd | 0.59mi | 3/1.0 (+1) | 768 (+14%) | 3mo | $97,000 | $126 | 42 |
| 3015 Lemuel St | 0.73mi | 2/1.0 | 592 (-12%) | 6mo | $29,900 | $51 | 41 |
Match score weights: distance 35% · size 25% · config 20% · recency 20%. Top-matched comps best support the ARV.
Projected returns pro-forma
-3.0% appreciation · 3.0% rent growth · sell at horizon
- IRR
- -24.3%
- Equity multiple
- 0.17×
- Total profit
- $-26,671
- Equity at exit
- $17,132
- IRR
- -19.7%
- Equity multiple
- -0.04×
- Total profit
- $-33,578
- Equity at exit
- $9,934
Cash invested: $32,172 (down + closing). Projections, not guarantees.
Landlord ↔ Tenant lean methodology
- Overall (STATE)
- 62 Landlord-Friendly
- State Michigan
- 62 Landlord-Friendly · EVEN
- County
- — inherits STATE
- City
- — inherits STATE
ZIP-level market 49444
- Active inventory
- 237
- Price-to-rent
- 11.5×
Monthly cashflow live
- Estimated rent
- $830 medium interval (Pro) →
- Mortgage (P&I)
- −$603
- Tax from tax record
- −$132 /mo · $1,584/yr
- Insurance
- −$48
- HOA
- −$0
- Vacancy / Maint / Mgmt
- −$174
- Net cashflow
- $-127
Break-even live
UW: 25.0% down · 7.5% · 30yr · 1.5% tax · 5.0% vac · 8.0% maint · 8.0% mgmt
Financing live
Cash to close
- Down payment
- $28,725
- Closing costs
- $3,447
- Reserves months
- —
- Total cash needed
- —
Loan-product check · same deal, 3 products live
Conventional
25% down · 7.5% · 30yr
- Down + closing
- —
- Monthly P&I
- —
- Monthly cashflow
- —
- DSCR
- —
- Eligible?
- —
Personal DTI + credit; lowest rate.
DSCR
20% down · 8.5% · 30yr
- Down + closing
- —
- Monthly P&I
- —
- Monthly cashflow
- —
- DSCR
- —
- Eligible?
- —
No personal income docs; deal must DSCR.
Hard money
10% down · 12.0% · 12mo
- Down + closing
- —
- Monthly P&I
- —
- Monthly cashflow
- —
- DSCR
- —
- Eligible?
- —
Short-term bridge; refi at stabilization.
Rent comps 3 comps
| Address | Beds | Baths | Sqft | Rent | $/sqft | DOM | Units | Dist |
|---|---|---|---|---|---|---|---|---|
| 2901 Temple St Unit 2 Muskegon Heights, MI | 1.0 | 1.0 | 400 | $750 | $1.88 | 21d | 1 | 0.78mi |
| 2516 5th St Apt 1 Muskegon Heights, MI | 1.0 | 1.0 | 630 | $775 | $1.23 | 21d | 1 | 0.99mi |
| 2516 5th St Apt 2 Muskegon Heights, MI | 1.0 | 1.0 | 630 | $750 | $1.19 | 21d | 1 | 0.99mi |
Listing history 12 events
-
2026-06-19days on market $114,900 Active 16 DOM
-
2026-06-18days on market $114,900 Active 15 DOM
-
2026-06-17days on market $114,900 Active 14 DOM
-
2026-06-16days on market $114,900 Active 13 DOM
-
2026-06-15days on market $114,900 Active 12 DOM
-
2026-06-14days on market $114,900 Active 10 DOM
-
2026-06-13days on market $114,900 Active 9 DOM
-
2026-06-10days on market $114,900 Active 7 DOM
-
2026-06-09days on market $114,900 Active 6 DOM
-
2026-06-08days on market $114,900 Active 5 DOM
-
2026-06-07remarks 699-char remark
-
2026-06-07$114,900 Active 4 DOM
ⓘ Source: listings_history table (triggers on properties + properties_extension) + one-shot
backfill from property_details.listing_events for pre-trigger history.
Tax reassessment forecast MI · Partial reset (capped growth)
- Current annual tax
- $1,584 · $132/mo
- Projected year-2 tax
- $1,677 · $140/mo
- Expected delta
- +$93/yr (+$8/mo · 5.9%)
ⓘ Screening estimate from a state-policy table — verify with the county assessor before closing.
Climate risk First Street
- Flood 6/10 Major FEMA zone X (unshaded) · 70% chance over 30 yrs
- Wildfire 1/10 Low
- Heat 1/10 Low 7 d/yr ≥93°F today · 15 d/yr by 30 yrs out
- Wind 1/10 Low
- Air quality 4/10 Moderate 4 unhealthy d/yr today · 6 by 30 yrs out
Nearby sold comps map
Loading sold comps map…
Walkable amenities ~0.75 mi
Loading nearby amenities…
Taxation est. · year 1
- Rental income
- $9,963
- − Mortgage interest
- −$6,436
- − Property taxes
- −$1,584
- − Insurance
- −$574
- − Repairs & maintenance
- −$797
- − Management
- −$797
- − Depreciation
- −$3,343
- Taxable loss
- −$3,568
- Est. tax savings @ 24.0%
- +$856
- After-tax cash flow
- $-662/yr
For passive investors: Depreciation is non-cash, so a rental often shows a tax loss while cash-flowing — sheltering income. Rental losses are passive: they offset passive income freely, and up to $25,000/yr can offset ordinary (W-2) income if you actively participate and your MAGI is under $100k (phasing out to $0 by $150k); unused losses carry forward. On sale, claimed depreciation is recaptured at up to 25%, and gains may owe capital-gains tax (a 1031 exchange can defer both). Figures are a year-1 estimate at your 24.0% rate — not tax advice; consult a CPA.
Schools (NCES district)
No district data.
Livability — Muskegon Heights
- Score
- 61/100
- State rank
- #574
- US rank
- #18269
Category grades
Schools grade is shown separately in the Schools card above.
Census & demographics
- Census place
- Muskegon Heights, MI
- County
- Muskegon County · 107,917 people
- Metro
- Muskegon, MI
- Population (ZIP)
- 26,372
- Household income
- $53,054
- Rent vs Own
- Severe rent burden
- 930.0
Population outlook (Muskegon County) Hauer SSP2
- Today (2025)
- 174,032 people
- By 2030
- 173,365 · -0.4%
- By 2040
- 168,877 · -3.0%
- By 2050
- 160,306 · -7.9%
- By 2075
- 134,426 · -22.8%
- By 2100
- 98,836 · -43.2%
Race, ethnicity, and origin ACS 2023
- Neighborhood character
- Diverse neighborhood (Simpson 0.55)
- Race & ethnicity
- White 59% Black 31% Two or more races 6% Hispanic / Latino 4% Native American 1%
- Common ancestry
- Iranian 6% Romanian 4% Lithuanian 2%
- Foreign-born
- 1% · Canada
- Languages at home
- 97% English-only · Spanish 2%
Political lean MEDSL · Muskegon
- 2024 margin
- Toss-up / Even · D 48.4% · R 50.2% · Other 1.5%
- 2008→2024 swing
- -31.1pp toward R · 2008: 29.3pp · 2024: -1.8pp
- All cycles
- 2024: R+1.8 2020: D+0.6 2016: D+0.9 2012: D+17.8 2008: D+29.3
Not yet ingested
- Civics
- —
Market trends
- HPI YoY
- ▼ -150.02%
- Current HPI
- 209.2698
- Rent YoY
- —
- Metro
- Muskegon, MI
- State GDP YoY
- ▲ 1.37%
- F500 in state
- 28
Industry mix (Fortune 500 HQ in MI)
| Industry | F500 HQs | Revenue |
|---|---|---|
| Automotive Parts | 3 | $48B |
|
||
| Automotive | 2 | $372B |
|
||
| Chemicals | 1 | $45B |
|
||
| Automotive Retail | 1 | $29B |
|
||
| Healthcare / Medical Devices | 1 | $23B |
|
||
| Automotive Technology | 1 | $20B |
|
||
Price history
+857.5% since first listed30 events — show timeline
- 2026-06-03 Listed $114,900 REALCOMP
- 2026-06-03 Listed $114,900 SW Michigan MLS
- 2026-06-03 Listed $114,900 MiRealSource-MiMLS
- 2025-03-04 Sold (Public Records) $630,000 Public Records
- 2024-04-09 Listed $75,000 SW Michigan MLS
- 2024-04-09 Listed $75,000 MiRealSource-MiMLS
- 2024-04-09 Listed $75,000 REALCOMP
- 2024-04-09 Sold (MLS) $75,000 SW Michigan MLS
- 2024-04-09 Sold (MLS) $75,000 MiRealSource-MiMLS
- 2024-04-09 Sold (MLS) $75,000 REALCOMP
- 2020-05-15 Sold (MLS) $30,500 SW Michigan MLS
- 2020-05-15 Sold (MLS) $30,500 REALCOMP
- 2020-04-23 Pending — SW Michigan MLS
- 2020-04-16 Price Changed $34,900 SW Michigan MLS
- 2020-04-16 Relisted — SW Michigan MLS
- 2019-12-13 Listing Removed — SW Michigan MLS
- 2019-10-11 Listed $34,900 MiRealSource-MiMLS
- 2019-10-11 Listed $36,900 SW Michigan MLS
- 2019-10-11 Listed $34,900 REALCOMP
- 2018-09-13 Listing Removed — MiRealSource-MiMLS
- 2018-09-13 Listing Removed — SW Michigan MLS
- 2018-09-13 Listing Removed — REALCOMP
- 2018-09-07 Listed $34,900 MiRealSource-MiMLS
- 2018-09-07 Listed $34,900 SW Michigan MLS
- 2018-09-07 Listed $34,900 REALCOMP
- 2015-03-20 Listing Removed — SW Michigan MLS
- 2015-03-20 Listing Removed — REALCOMP
- 2013-11-08 Listed $14,500 SW Michigan MLS
- 2013-11-08 Listed $14,500 REALCOMP
- 1995-05-04 Sold (Public Records) $12,000 Public Records
Property tax history
+4.8%/yrLatest (2025): $1,584 · +51.0% YoY. Source: county tax records.
Cash-flow waterfall
monthlySold comps — $/sqft
last 12 mo · ≤1 miLoading sold comps…