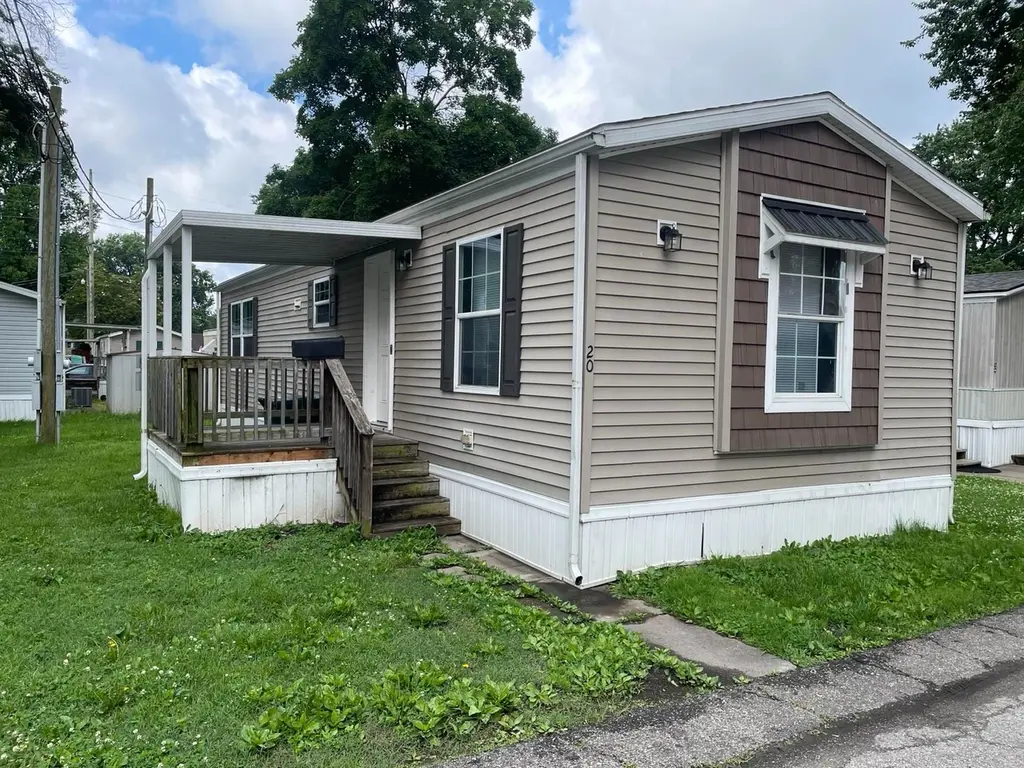
Adventure Homes Mojave Plan
Louisville/Jefferson County metro government (balance), KY 40216
$37,900B-
1 bd · 1.0 ba ·
768 sqft ·
Built —
· Manufactured
· Active
· 24 DOM
Cashflow @ list (25.0% down · 7.5%)
Estimated rent
$704/mo
Mortgage (P&I)
−$199
Tax + insurance
−$63
HOA
−$0
Vac / Maint / Mgmt
−$148
Net cashflow
$294/mo
Annual
$3,530/yr
Cap rate
15.61%
Cash-on-cash
33.26%
DSCR
2.48
1% rule
1.86%
Cash to close
$10,612
Investor read
- This is a 1-bed/1.0-bath manufactured listed at $38k. Condition is rated good.
- At list price, monthly cash flow is $294 ($4k/yr) — positive.
- The deal already cash-flows at list — no discount required.
- Meets the 1% rule at list price ($704 rent vs $38k).
- It's been on market 24 days — a 2% lower offer ($37k) is reasonable based on typical stale-listing flexibility.
- Recommended offer: $37k (1.5% below list) — sets the bar for market timing.
- Local home prices are declining (-3.0%/yr); year-one equity from $262 of loan paydown is wiped out by about $1k of value loss. Plan a longer hold.
- Location reads: area grade B — affects rentability + tenant quality, not the cash-flow math above.
- Jefferson County (urban): math 19% / reading 35% proficiency, ranked #121 of 165 in KY (top 73%) — low school quality limits family demand, transient renter base, plan for 1-2y turnover.
- Zoned schools: Cane Run Elementary (math 2% / reading 12%, grade F, #662 of 676 statewide, top 99%, 377 students, 80% FRL); Stuart Academy (math 4% / reading 17%, grade F, #216 of 217 statewide, top 100%, 1,105 students, 72% FRL); Western High (math 2% / reading 12%, grade F, #248 of 254 statewide, top 98%, 869 students, 77% FRL) — zoned schools average 76% FRL vs 56% district-wide (20 pts higher); higher-poverty schools than district average — tighter screening recommended.
- Zoned-school proficiency averages 8% at this address vs 27% district-wide (-19 pts) — the specific schools serving this property underperform the Jefferson County average; the district grade overstates school quality for this exact location.
- Market conditions: Rents flat; 211 active listings in the ZIP; 7 comparable units currently listed for rent nearby; rentals at typical pace (median 20d on market — plan ~3-4 weeks tenant-placement turnaround); 2,836 units permitted in Jefferson County in 2024 (1,558 in 5+ unit buildings).
- Jefferson County population projected at +13% by 2050 — modest demand growth; plan on rents tracking national, not racing it.
- At projected returns (-3.0% appreciation + 0.6% rent growth), your $11k cash investment doubles in ~4 years — after that, you're playing with house money.
- Climate carrying-cost: extreme-heat days projected 7→20/yr by 2055 (HVAC capex compounding) — expect insurance premiums to compound above CPI over the hold.
- Cap rate 15.6% vs local median 4.1% in Louisville/Jefferson County metro government (balance) — top-decile yield for the area; either an underpriced asset or a hidden risk that comps aren't pricing in. Stress-test before assuming the spread holds.
- This rent is only 15% of the median local income ($56k/yr) — well below the 30% rent-burden line; pricing power to push rent on renewal without tenant pushback.
Questions for listing agent
- Is there a deadline driving the sale (1031 exchange, divorce, estate, relocation)? That informs how much negotiation room exists.
- What's the average days-on-market for RENTAL listings here right now (not sales)? A rising rental-DOM trend means longer vacancies and softer asking-rent achievability than the comps imply.
- What's the recent tenant-quality profile in this submarket — average credit score on applications, eviction rate, late-payment / NSF rate, and stable-employment percentage? A property-management company in the area should have these aggregated.
- How much new for-sale + rental construction is in the pipeline within 1–3 miles? Heavy new supply typically softens prices + rents 12–24 months out; constrained supply supports both.
CashFlowRE · CFR-GX19JG4QYZGZSE
· Data 5 h ago
cashflowre.app · 2026-05-29