 🏗️ New Construction
Adventure Homes Mojave Plan · Louisville/Jefferson County metro government (balance), KY
Flood risk 1/10 · Minimal
- FEMA flood zone
- X (shaded)
- Chance of flooding over 30 yrs
- 0.0%
- Est. flood insurance / yr
- $507 – $1,088
Fire risk 1/10 · Minimal
- Est. fire insurance / yr
- $839 – $1,559
Heat risk 5/10 · Moderate
- Hot days now (above 105°F)
- 7 days/yr
- Hot days in 30 yrs
- 20 days/yr
Wind risk 2/10 · Minimal
- Chance of severe wind over 30 yrs
- 1.0%
Air-quality risk 2/10 · Minimal
- Unhealthy air days now
- 1 days/yr
- Unhealthy air days in 30 yrs
- 3 days/yr
Risk factors via First Street. Map © Google.
Why this score? — see what drove the B- grade
The composite is a weighted blend of 9 inputs, each scored 0–100. Each bar is that input's sub-score; the figure is the points it added to the 100-point composite (weight × sub-score).
- Cash flow +30.0/30.0
- 1% rule +10.0/10.0
- DSCR +10.0/10.0
- ARV discount +7.5/15.0
- Condition / age +3.8/5.0
- Rent growth +2.6/5.0
- Livability +2.5/5.0
- Schools +2.3/10.0
- Appreciation +0.0/10.0
$37,900
🖨 Deal sheet (PDF) 📄 Offer letter ✓ Due diligence
Listing remarks
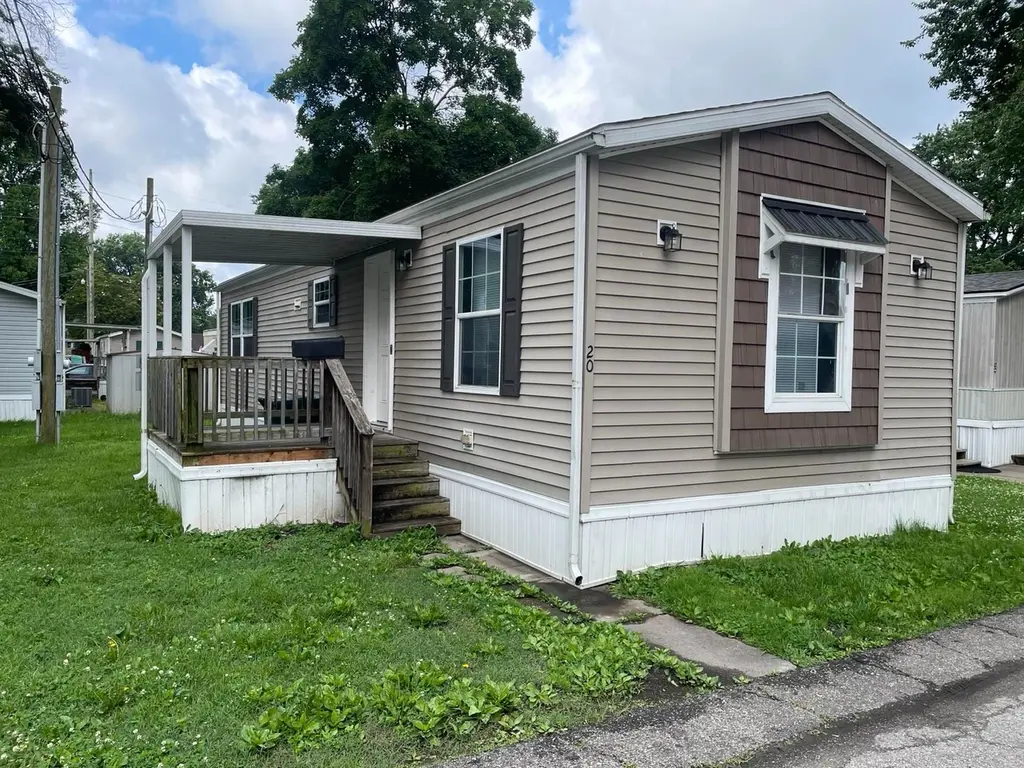
This well-kept 1-bedroom, 1-bath manufactured home in Pioneer Acres offers 768 square feet of efficient living space in Louisville, KY. Built in 2018, this Adventure Homes Mojave features a practical layout designed for comfortable everyday living. The interior provides a functional flow with open common areas and a clean, modern feel throughout. Located within a quiet and established community, this home offers convenient access to nearby amenities while maintaining a peaceful residential setting. Ideal for individuals or couples seeking an affordable housing option with updated construction and solid value.
Key facts
- Open common areas
- Practical layout
- Convenient access
Tags
Property features AI
Finance
- Other: Address: Adventure Homes Mojave Plan, Louisville, KY 40216; Status: Active
- Financial info: List price $37,900
Exterior
- Utilities: Forced-air heating (listed under utilities)
- Home design: Plan: Adventure Homes Mojave; New construction plan
- Construction: 768 living area
- Exterior features: Shake roof
Interior
- Bedrooms: 1 bedroom
- Bathrooms: 1 full bathroom
- Heating & cooling: Forced-air heating
- Interior features: 1 total bathroom; 1 total bedroom
Neighborhood map
What this means for you Summary
Snapshot
- This is a 1-bed/1.0-bath manufactured listed at $38k. Condition is rated good.
Deal economics
- At list price, monthly cash flow is $294 ($4k/yr) — positive.
- The deal already cash-flows at list — no discount required.
- Meets the 1% rule at list price ($704 rent vs $38k).
- Recommended offer: $37k (1.5% below list) — sets the bar for market timing.
- Cap rate 15.6% vs local median 4.1% in Louisville/Jefferson County metro government (balance) — top-decile yield for the area; either an underpriced asset or a hidden risk that comps aren't pricing in. Stress-test before assuming the spread holds.
Location & tenants
- Location reads: area grade B — affects rentability + tenant quality, not the cash-flow math above.
- Jefferson County (urban): math 19% / reading 35% proficiency, ranked #121 of 165 in KY (top 73%) — low school quality limits family demand, transient renter base, plan for 1-2y turnover.
- Zoned schools: Cane Run Elementary (math 2% / reading 12%, grade F, #662 of 676 statewide, top 99%, 377 students, 80% FRL); Stuart Academy (math 4% / reading 17%, grade F, #216 of 217 statewide, top 100%, 1,105 students, 72% FRL); Western High (math 2% / reading 12%, grade F, #248 of 254 statewide, top 98%, 869 students, 77% FRL) — zoned schools average 76% FRL vs 56% district-wide (20 pts higher); higher-poverty schools than district average — tighter screening recommended.
- Zoned-school proficiency averages 8% at this address vs 27% district-wide (-19 pts) — the specific schools serving this property underperform the Jefferson County average; the district grade overstates school quality for this exact location.
- Market conditions: Rents flat; 211 active listings in the ZIP; 7 comparable units currently listed for rent nearby; rentals at typical pace (median 20d on market — plan ~3-4 weeks tenant-placement turnaround); 2,836 units permitted in Jefferson County in 2024 (1,558 in 5+ unit buildings).
- This rent is only 15% of the median local income ($56k/yr) — well below the 30% rent-burden line; pricing power to push rent on renewal without tenant pushback.
Forward outlook
- Local home prices are declining (-3.0%/yr); year-one equity from $262 of loan paydown is wiped out by about $1k of value loss. Plan a longer hold.
- Jefferson County population projected at +13% by 2050 — modest demand growth; plan on rents tracking national, not racing it.
- At projected returns (-3.0% appreciation + 0.6% rent growth), your $11k cash investment doubles in ~4 years — after that, you're playing with house money.
Negotiation context
- It's been on market 24 days — a 2% lower offer ($37k) is reasonable based on typical stale-listing flexibility.
Risks & watch-outs
- Climate carrying-cost: extreme-heat days projected 7→20/yr by 2055 (HVAC capex compounding) — expect insurance premiums to compound above CPI over the hold.
Questions for the listing agent
- Is there a deadline driving the sale (1031 exchange, divorce, estate, relocation)? That informs how much negotiation room exists.
- What's the average days-on-market for RENTAL listings here right now (not sales)? A rising rental-DOM trend means longer vacancies and softer asking-rent achievability than the comps imply.
- What's the recent tenant-quality profile in this submarket — average credit score on applications, eviction rate, late-payment / NSF rate, and stable-employment percentage? A property-management company in the area should have these aggregated.
- How much new for-sale + rental construction is in the pipeline within 1–3 miles? Heavy new supply typically softens prices + rents 12–24 months out; constrained supply supports both.
Investment metrics
- 1% rule
- 1.86% ✓
- Cap rate
- 15.61%
- Cash-on-cash
- 33.26%
- DSCR
- 2.48
- GRM
- 4.5
CMA / ARV
No comps found within radius.
Projected returns pro-forma
-3.0% appreciation · 0.57% rent growth · sell at horizon
- IRR
- 25.7%
- Equity multiple
- 2.03×
- Total profit
- $10,924
- Equity at exit
- $5,651
- IRR
- 31.9%
- Equity multiple
- 3.55×
- Total profit
- $27,112
- Equity at exit
- $3,277
Cash invested: $10,612 (down + closing). Projections, not guarantees.
Landlord ↔ Tenant lean methodology
- Overall (STATE)
- 83 Strongly Landlord-Friendly
- State Kentucky
- 83 Strongly Landlord-Friendly · R+16
- County
- — inherits STATE
- City
- — inherits STATE
ZIP-level market 40216
- Rents YoY
- 0.6%
- Active inventory
- 211
- Price-to-rent
- 4.5×
Monthly cashflow live
- Estimated rent
- $704 high interval (Pro) →
- Mortgage (P&I)
- −$199
- Tax est. 1.5%
- −$47 /mo · $568/yr
- Insurance
- −$16
- HOA
- −$0
- Lot rent leased land?
- −$0
- Vacancy / Maint / Mgmt
- −$148
- Net cashflow
- $294
Break-even live
Sensitivity live
| Price | -10% $320 | -5% $307 | +0% $294 | +5% $281 | +10% $268 |
|---|---|---|---|---|---|
| Rent | -10% $239 | -5% $266 | +0% $294 | +5% $322 | +10% $350 |
| Rate | -1.0pp $313 | -0.5pp $304 | base $294 | +0.5pp $284 | +1.0pp $274 |
UW: 25.0% down · 7.5% · 30yr · 1.5% tax · 5.0% vac · 8.0% maint · 8.0% mgmt
Financing live
Cash to close
- Down payment
- $9,475
- Closing costs
- $1,137
- Reserves months
- —
- Total cash needed
- —
Loan-product check · same deal, 3 products live
Conventional
25% down · 7.5% · 30yr
- Down + closing
- —
- Monthly P&I
- —
- Monthly cashflow
- —
- DSCR
- —
- Eligible?
- —
Personal DTI + credit; lowest rate.
DSCR
20% down · 8.5% · 30yr
- Down + closing
- —
- Monthly P&I
- —
- Monthly cashflow
- —
- DSCR
- —
- Eligible?
- —
No personal income docs; deal must DSCR.
Hard money
10% down · 12.0% · 12mo
- Down + closing
- —
- Monthly P&I
- —
- Monthly cashflow
- —
- DSCR
- —
- Eligible?
- —
Short-term bridge; refi at stabilization.
Rent comps 7 comps
| Address | Beds | Baths | Sqft | Rent | $/sqft | DOM | Units | Dist |
|---|---|---|---|---|---|---|---|---|
| 3401 Shanks Ln Louisville, KY | 1.0–2.0 | 1.0 | 875 | $849 | $0.97 | 4d | 3 | 0.69mi |
| 3508 Fern Lea Rd Louisville, KY | 1.0 | 1.0 | 800 | $912 | $1.14 | 18d | 3 | 1.06mi |
| 3521 Janell Rd Louisville, KY | 1.0 | 1.0 | 800 | $900 | $1.12 | 18d | 1 | 1.25mi |
| 3521 Janell Rd #1 Louisville, KY | 1.0 | 1.0 | 800 | $900 | $1.12 | 26d | 1 | 1.25mi |
| 3520 Park Row Dr #1 Shively, KY | 1.0 | 1.0 | 800 | $950 | $1.19 | 26d | 1 | 1.27mi |
| 3107 Melody Acres Ln Unit 4 Louisville, KY | 2.0 | 1.0 | 750 | $825 | $1.10 | 19d | 1 | 1.47mi |
| 3204 Melody Acres Ln Unit 3202-3 Louisville, KY | 2.0 | 1.0 | 750 | $950 | $1.27 | 26d | 1 | 1.50mi |
Listing history 16 events
-
2026-06-22days on market $37,900 Active 24 DOM
-
2026-06-21days on market $37,900 Active 23 DOM
-
2026-06-18days on market $37,900 Active 20 DOM
-
2026-06-17days on market $37,900 Active 19 DOM
-
2026-06-16days on market $37,900 Active 18 DOM
-
2026-06-15days on market $37,900 Active 17 DOM
-
2026-06-13days on market $37,900 Active 15 DOM
-
2026-06-10days on market $37,900 Active 12 DOM
-
2026-06-09days on market $37,900 Active 11 DOM
-
2026-06-08days on market $37,900 Active 10 DOM
-
2026-06-07days on market $37,900 Active 9 DOM
-
2026-06-03days on market $37,900 Active 5 DOM
-
2026-06-02days on market $37,900 Active 4 DOM
-
2026-06-01days on market $37,900 Active 3 DOM
-
2026-05-31remarks 616-char remark
-
2026-05-31$37,900 Active 2 DOM
ⓘ Source: listings_history table (triggers on properties + properties_extension) + one-shot
backfill from property_details.listing_events for pre-trigger history.
Climate risk First Street
- Flood 1/10 Low FEMA zone X (shaded) · 0% chance over 30 yrs
- Wildfire 1/10 Low
- Heat 5/10 Major 7 d/yr ≥105°F today · 20 d/yr by 30 yrs out
- Wind 2/10 Low 100% chance of damaging wind over 30 yrs
- Air quality 2/10 Low 1 unhealthy d/yr today · 3 by 30 yrs out
Nearby sold comps map
Loading sold comps map…
Walkable amenities ~0.75 mi
Loading nearby amenities…
Taxation est. · year 1
- Rental income
- $8,447
- − Mortgage interest
- −$2,123
- − Property taxes
- −$568
- − Insurance
- −$190
- − Repairs & maintenance
- −$676
- − Management
- −$676
- − Depreciation
- −$1,103
- Taxable income
- $3,112
- Est. tax owed @ 24.0%
- −$747
- After-tax cash flow
- $2,783/yr
For passive investors: Depreciation is non-cash, so a rental often shows a tax loss while cash-flowing — sheltering income. Rental losses are passive: they offset passive income freely, and up to $25,000/yr can offset ordinary (W-2) income if you actively participate and your MAGI is under $100k (phasing out to $0 by $150k); unused losses carry forward. On sale, claimed depreciation is recaptured at up to 25%, and gains may owe capital-gains tax (a 1031 exchange can defer both). Figures are a year-1 estimate at your 24.0% rate — not tax advice; consult a CPA.
Condition & rehab AI · 12 photos
This well-maintained 1-bedroom, 1-bath manufactured home in Pioneer Acres offers a good condition with a practical layout and efficient living space. It is located in a quiet and established community, making it an ideal affordable housing option with updated construction and solid value.
Value-add opportunities
- Both Painting the exterior and interior walls — Fresh paint can enhance curb appeal and interior aesthetics.
- Both Landscaping improvements — A well-maintained yard can increase both resale and rental value.
- Both HVAC maintenance — A clean and efficient HVAC system can improve comfort and energy efficiency, attracting more buyers/renters.
Renovation cost estimate screening
Value-add ROI direction
- Both Painting the exterior and interior walls — Fresh paint can enhance curb appeal and interior aesthetics. ↑
- Both Landscaping improvements — A well-maintained yard can increase both resale and rental value. ↑
- Both HVAC maintenance — A clean and efficient HVAC system can improve comfort and energy efficiency, attracting more buyers/renters. ↑
ⓘ Cost ranges are severity-bucket heuristics (US national rule-of-thumb). Get contractor quotes + a written scope before underwriting a rehab budget.
Schools (NCES district)
- District
- Jefferson County
- NCES district ID
- 2102990
- Math proficiency
- 19% ▼ -17.00%
- Reading proficiency
- 35% ▼ -11.00%
- Median HH income
- $47,885
- Composite
- 23.45/100
- National rank
- #7884
- State rank
- #121 of 165 in KY
Livability — Louisville/Jefferson County metro government (balance)
No livability data for this city. (Only ~50 U.S. cities are tracked.)
Census & demographics
- Census place
- Louisville/Jefferson County metro government (balance), KY
- County
- Jefferson County · 790,184 people
- City population
- 419,741
- Metro
- Louisville/Jefferson County, KY-IN
- Population (ZIP)
- 44,047
- Household income
- $56,441
- Rent vs Own
- Severe rent burden
- 1434.0
Population outlook (Jefferson County) Hauer SSP2
- Today (2025)
- 823,112 people
- By 2030
- 849,343 · +3.2%
- By 2040
- 895,696 · +8.8%
- By 2050
- 933,630 · +13.4%
- By 2075
- 1,028,262 · +24.9%
- By 2100
- 1,072,675 · +30.3%
Race, ethnicity, and origin ACS 2023
- Neighborhood character
- Diverse neighborhood (Simpson 0.60)
- Race & ethnicity
- Black 45% White 43% Hispanic / Latino 6% Two or more races 6% Asian 1%
- Hispanic origin (detail)
- Mexican 2% Cuban 3%
- Common ancestry
- Lithuanian 1% Italian 1% Slovak 1%
- Foreign-born
- 8% · Canada, Vietnam
- Languages at home
- 89% English-only · Spanish 7% French/Haitian/Cajun 1% Arabic 1%
Political lean MEDSL · Jefferson
- 2024 margin
- D (+16.6) · D 57.4% · R 40.9% · Other 1.7%
- 2008→2024 swing
- +4.5pp toward D · 2008: 12.0pp · 2024: 16.6pp
- All cycles
- 2024: D+16.6 2020: D+20.1 2016: D+13.3 2012: D+11.1 2008: D+12.0
Not yet ingested
- Civics
- —
Market trends
- HPI YoY
- ▼ -234.72%
- Current HPI
- 269.5447
- Rent YoY
- ▲ 0.57%
- Metro
- Louisville/Jefferson County, KY-IN
- State GDP YoY
- ▲ 1.81%
- F500 in state
- 4
Industry mix (Fortune 500 HQ in KY)
| Industry | F500 HQs | Revenue |
|---|---|---|
| Healthcare | 1 | $118B |
|
||
| Food / Beverage | 1 | $7B |
|
||
Cash-flow waterfall
monthlySold comps — $/sqft
last 12 mo · ≤1 miLoading sold comps…