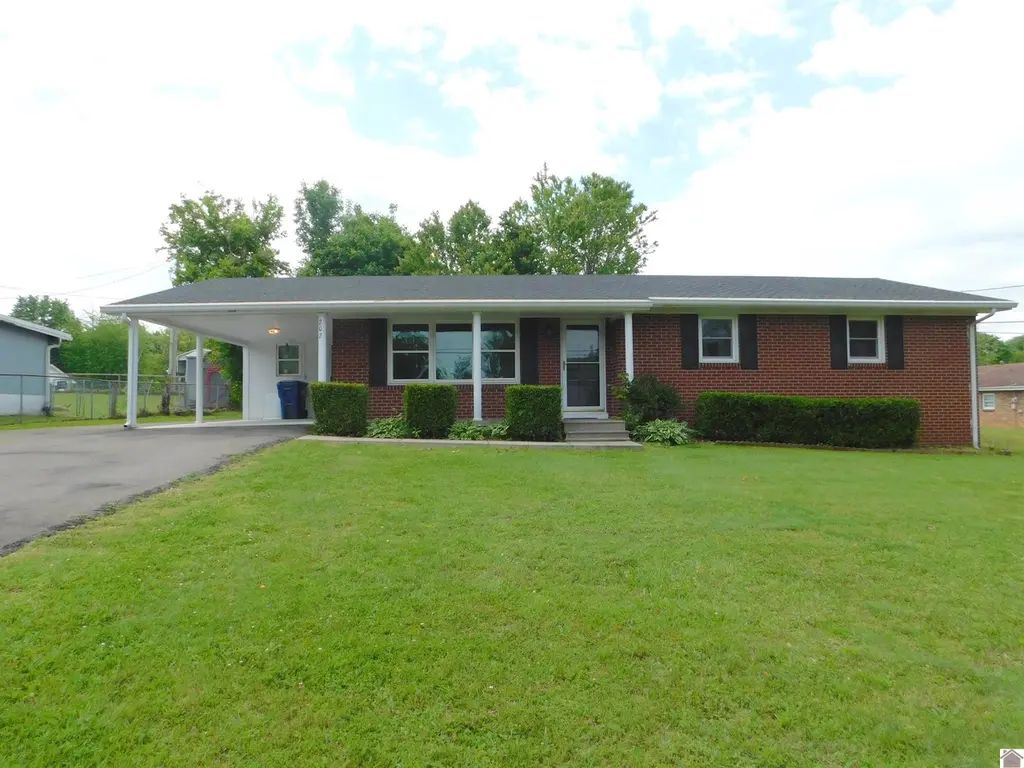
202 E 19th St
Benton, KY 42025
$198,000C
3 bd · 2.0 ba ·
1,508 sqft ·
Built —
· SingleFamily
· Pending
· 15 DOM
Cashflow @ list (25.0% down · 7.5%)
Estimated rent
$1,975/mo
Mortgage (P&I)
−$1,038
Tax + insurance
−$154
HOA
−$0
Vac / Maint / Mgmt
−$415
Net cashflow
$368/mo
Annual
$4,419/yr
Cap rate
8.52%
Cash-on-cash
7.97%
DSCR
1.35
1% rule
1.00%
Cash to close
$55,440
Investor read
- This is a 3-bed/2.0-bath single-family listed at $198k.
- At list price, monthly cash flow is $368 ($4k/yr) — positive.
- The deal already cash-flows at list — no discount required.
- To meet the 1% rule (rent ≥ 1% of price), the offer needs to be $198k (0.3% below list).
- It's been on market 15 days — a 2% lower offer ($195k) is reasonable based on typical stale-listing flexibility.
- Recommended offer: $195k (1.5% below list) — sets the bar for market timing.
- In year one you build about $21k of equity ($1k loan paydown + $20k appreciation (10.0% local appreciation)).
- Location reads 69/100 on livability (#171 in KY) — a middle-class / working-renter tenant base. Strengths: crime A+, cost of living A+, housing A+; Watch: amenities F, commute F.
- Marshall County (rural): math 29% / reading 38% proficiency, ranked #73 of 165 in KY (top 44%) — families likely to look elsewhere, expect single-tenant / working-renter base with shorter leases.
- Zoned schools: South Marshall Elementary School (math 27% / reading 27%, grade F, #434 of 676 statewide, top 69%, 289 students, 64% FRL); South Marshall Middle (math 21% / reading 39%, grade F, #146 of 217 statewide, top 69%, 462 students, 55% FRL); Marshall County High School (math 26% / reading 30%, grade F, #151 of 254 statewide, top 61%, 1,256 students, 43% FRL).
- Market conditions: 179 active listings in the ZIP; 1 comparable units currently listed for rent nearby; 121 units permitted in Marshall County in 2024 (5 in 5+ unit buildings).
- Marshall County population projected to shrink 9% by 2050 — rents likely to lag national; underwrite the cash flow, not the appreciation.
- 2 sale attempts since 5y ago with the ask held roughly flat each time — persistent listings suggest the price (not the market) is what's stuck; bring a comps-based counter.
- At projected returns (10.0% appreciation + 3.0% rent growth), your $55k cash investment doubles in ~3 years — after that, you're playing with house money.
- By year 2, paydown + projected appreciation supports a ~$34k cash-out refi (75% LTV) — recoverable capital for the next deal without selling this one.
- Climate carrying-cost: extreme-heat days projected 7→21/yr by 2055 (HVAC capex compounding) — expect insurance premiums to compound above CPI over the hold.
- Cap rate 8.5% vs local median 4.9% in Benton — top-decile yield for the area; either an underpriced asset or a hidden risk that comps aren't pricing in. Stress-test before assuming the spread holds.
Questions for listing agent
- Is there a deadline driving the sale (1031 exchange, divorce, estate, relocation)? That informs how much negotiation room exists.
- Schools are D-rated, which usually means shorter tenancies and higher turnover. Who's the typical renter profile here, and what's been the actual vacancy rate?
- What's the average days-on-market for RENTAL listings here right now (not sales)? A rising rental-DOM trend means longer vacancies and softer asking-rent achievability than the comps imply.
- What's the recent tenant-quality profile in this submarket — average credit score on applications, eviction rate, late-payment / NSF rate, and stable-employment percentage? A property-management company in the area should have these aggregated.
- How much new for-sale + rental construction is in the pipeline within 1–3 miles? Heavy new supply typically softens prices + rents 12–24 months out; constrained supply supports both.
CashFlowRE · CFR-GX1AA1BN7QQ03Q
· Data 4 weeks ago
cashflowre.app · 2026-05-29