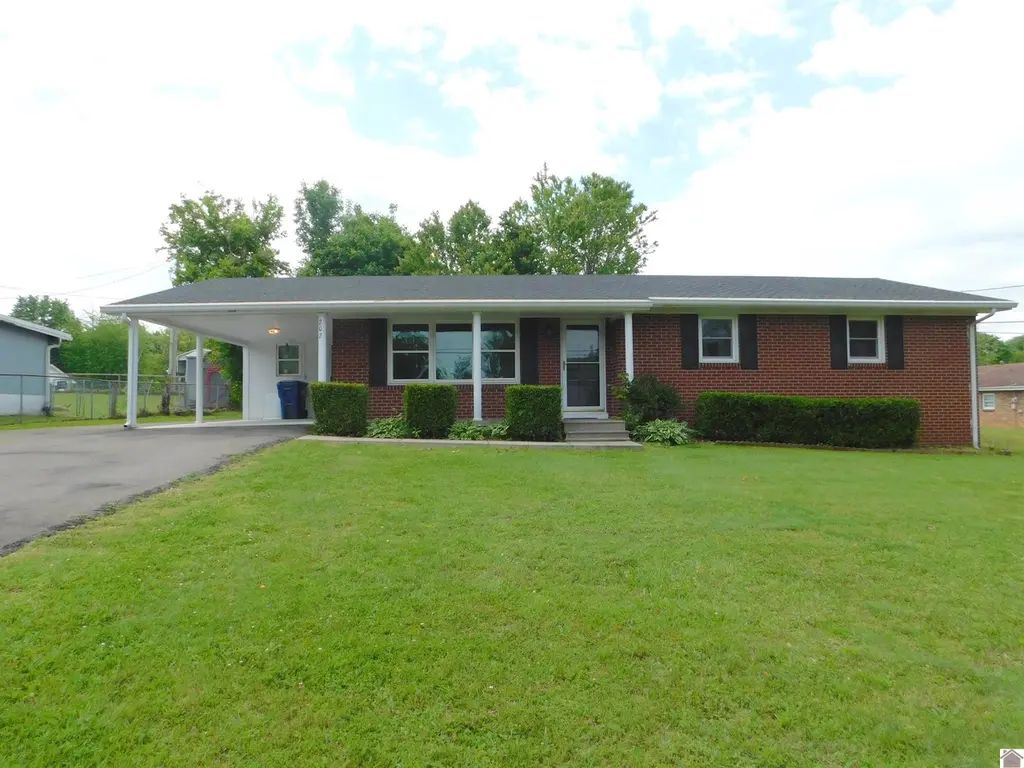
202 E 19th St · Benton, KY
Flood risk 1/10 · Minimal
- FEMA flood zone
- X (unshaded)
- Chance of flooding over 30 yrs
- 0.0%
- Est. flood insurance / yr
- $507 – $1,088
Fire risk 4/10 · Minor
- Est. fire insurance / yr
- $839 – $1,559
Heat risk 6/10 · Moderate
- Hot days now (above 109°F)
- 7 days/yr
- Hot days in 30 yrs
- 21 days/yr
Wind risk 3/10 · Minor
- Chance of severe wind over 30 yrs
- 7.0%
Air-quality risk 1/10 · Minimal
- Unhealthy air days now
- 0 days/yr
- Unhealthy air days in 30 yrs
- 0 days/yr
Risk factors via First Street. Map © Google.
Why this score? — see what drove the C grade
The composite is a weighted blend of 9 inputs, each scored 0–100. Each bar is that input's sub-score; the figure is the points it added to the 100-point composite (weight × sub-score).
- Cash flow +23.5/30.0
- Appreciation +10.0/10.0
- DSCR +7.5/10.0
- 1% rule +5.0/10.0
- Livability +3.5/5.0
- Schools +2.9/10.0
- Rent growth +2.5/5.0
- Condition / age +2.5/5.0
- ARV discount +0.0/15.0
$198,000
🖨 Deal sheet (PDF) 📄 Offer letter ✓ Due diligence
Listing remarks MLS
Recently Remodeled Home in Benton. 3 Bedrooms, 1 1/2 Bath includes new windows, HVAC, light fixtures, paved driveway, new concrete on carport, and fenced back yard. List price includes seller paid new roof.
Key facts
- Functional carport
- New refrigerator
- Fresh landscaping
Tags
Property features AI
Exterior
- Parking: Carport (1 space)
- Utilities: Public water; Public sewer
- Home design: Single family residence; Single-story
- Construction: Block and frame construction; Composition roof
- Exterior features: Covered patio; Patio; Fenced yard; Outbuilding
Interior
- Kitchen: Dishwasher; Refrigerator; Cooktop
- Flooring: Laminate; Tile; Vinyl
- Bathrooms: 1 full bathroom; 1 half bathroom
- Heating & cooling: Central air conditioning; Forced air heating
- Interior features: Covered patio; Patio; Fenced yard; Outbuilding
- Laundry & utility: Electric water heater
Neighborhood map
What this means for you Summary
Snapshot
- This is a 3-bed/2.0-bath single-family listed at $198k.
Deal economics
- At list price, monthly cash flow is $368 ($4k/yr) — positive.
- The deal already cash-flows at list — no discount required.
- To meet the 1% rule (rent ≥ 1% of price), the offer needs to be $198k (0.3% below list).
- Recommended offer: $195k (1.5% below list) — sets the bar for market timing.
- Cap rate 8.5% vs local median 4.9% in Benton — top-decile yield for the area; either an underpriced asset or a hidden risk that comps aren't pricing in. Stress-test before assuming the spread holds.
Location & tenants
- Location reads 69/100 on livability (#171 in KY) — a middle-class / working-renter tenant base. Strengths: crime A+, cost of living A+, housing A+; Watch: amenities F, commute F.
- Marshall County (rural): math 29% / reading 38% proficiency, ranked #73 of 165 in KY (top 44%) — families likely to look elsewhere, expect single-tenant / working-renter base with shorter leases.
- Zoned schools: South Marshall Elementary School (math 27% / reading 27%, grade F, #434 of 676 statewide, top 69%, 289 students, 64% FRL); South Marshall Middle (math 21% / reading 39%, grade F, #146 of 217 statewide, top 69%, 462 students, 55% FRL); Marshall County High School (math 26% / reading 30%, grade F, #151 of 254 statewide, top 61%, 1,256 students, 43% FRL).
- Market conditions: 179 active listings in the ZIP; 1 comparable units currently listed for rent nearby; 121 units permitted in Marshall County in 2024 (5 in 5+ unit buildings).
Forward outlook
- In year one you build about $21k of equity ($1k loan paydown + $20k appreciation (10.0% local appreciation)).
- Marshall County population projected to shrink 9% by 2050 — rents likely to lag national; underwrite the cash flow, not the appreciation.
- At projected returns (10.0% appreciation + 3.0% rent growth), your $55k cash investment doubles in ~3 years — after that, you're playing with house money.
- By year 2, paydown + projected appreciation supports a ~$34k cash-out refi (75% LTV) — recoverable capital for the next deal without selling this one.
Negotiation context
- It's been on market 15 days — a 2% lower offer ($195k) is reasonable based on typical stale-listing flexibility.
- 2 sale attempts since 5y ago with the ask held roughly flat each time — persistent listings suggest the price (not the market) is what's stuck; bring a comps-based counter.
Risks & watch-outs
- Climate carrying-cost: extreme-heat days projected 7→21/yr by 2055 (HVAC capex compounding) — expect insurance premiums to compound above CPI over the hold.
Questions for the listing agent
- Is there a deadline driving the sale (1031 exchange, divorce, estate, relocation)? That informs how much negotiation room exists.
- Schools are D-rated, which usually means shorter tenancies and higher turnover. Who's the typical renter profile here, and what's been the actual vacancy rate?
- What's the average days-on-market for RENTAL listings here right now (not sales)? A rising rental-DOM trend means longer vacancies and softer asking-rent achievability than the comps imply.
- What's the recent tenant-quality profile in this submarket — average credit score on applications, eviction rate, late-payment / NSF rate, and stable-employment percentage? A property-management company in the area should have these aggregated.
- How much new for-sale + rental construction is in the pipeline within 1–3 miles? Heavy new supply typically softens prices + rents 12–24 months out; constrained supply supports both.
Investment metrics
- 1% rule
- 1.00% ✗
- Cap rate
- 8.52%
- Cash-on-cash
- 7.97%
- DSCR
- 1.35
- GRM
- 8.4
CMA / ARV
- ARV (median comp)
- $161,315
- List price
- $198,000
- Delta
- 22.74%
- Verdict
- OVERPRICED
- Comps
- 20 within 1.0 mi
Show comp detail 12 sales within ~0.75 mi
| Address | Dist | Beds/Ba | Sqft | Sold | Price | $/sf | Match |
|---|---|---|---|---|---|---|---|
| 202 E 19th St | 0.00mi | 3/1.5 | 1,508 (0%) | 1mo | $190,000 | $126 | 98 |
| 209 E 20th St | 0.05mi | 3/1.5 | 1,356 (-10%) | 5mo | $165,000 | $122 | 75 |
| 1712 Sycamore St | 0.33mi | 3/2.0 | 1,464 (-3%) | 10mo | $210,000 | $143 | 71 |
| 1805 Park Ave | 0.03mi | 4/2.5 (+1) | 1,678 (+11%) | 8mo | $146,000 | $87 | 66 |
| 1318 Shelby Mccallum Dr | 0.55mi | 3/1.0 | 1,496 (-1%) | 4mo | $180,000 | $120 | 66 |
| 1315 Shelby Mccallum Dr | 0.60mi | 3/2.0 | 1,458 (-3%) | 1mo | $221,000 | $152 | 66 |
| 108 E 22nd St | 0.20mi | 2/2.0 (-1) | 1,324 (-12%) | 3mo | $75,000 | $57 | 63 |
| 812 14th St | 0.52mi | 3/2.0 | 1,472 (-2%) | 11mo | $175,000 | $119 | 62 |
| 608 E 12th St | 0.73mi | 2/2.0 (-1) | 1,496 (-1%) | 12mo | $187,475 | $125 | 50 |
| 1305 Birch St | 0.56mi | 4/1.0 (+1) | 1,608 (+7%) | 6mo | $126,000 | $78 | 48 |
| 704 E 14th St | 0.42mi | 3/1.0 | 1,286 (-15%) | 4mo | $156,000 | $121 | 48 |
| 1289 Bethel Rd | 0.73mi | 3/2.0 | 1,288 (-15%) | 2mo | $225,000 | $175 | 40 |
Match score weights: distance 35% · size 25% · config 20% · recency 20%. Top-matched comps best support the ARV.
Projected returns pro-forma
10.0% appreciation · 3.0% rent growth · sell at horizon
- IRR
- 30.1%
- Equity multiple
- 3.37×
- Total profit
- $131,214
- Equity at exit
- $178,374
- IRR
- 26.1%
- Equity multiple
- 7.63×
- Total profit
- $367,801
- Equity at exit
- $384,670
Cash invested: $55,440 (down + closing). Projections, not guarantees.
Landlord ↔ Tenant lean methodology
- Overall (STATE)
- 83 Strongly Landlord-Friendly
- State Kentucky
- 83 Strongly Landlord-Friendly · R+16
- County
- — inherits STATE
- City
- — inherits STATE
ZIP-level market 42025
- Home prices YoY
- 7.1%
- Active inventory
- 179
- Price-to-rent
- 8.4×
Monthly cashflow live
- Estimated rent
- $1,975 medium interval (Pro) →
- Mortgage (P&I)
- −$1,038
- Tax from tax record
- −$71 /mo · $854/yr
- Insurance
- −$82
- HOA
- −$0
- Vacancy / Maint / Mgmt
- −$415
- Net cashflow
- $368
Break-even live
Sensitivity live
| Price | -10% $480 | -5% $424 | +0% $368 | +5% $312 | +10% $256 |
|---|---|---|---|---|---|
| Rent | -10% $212 | -5% $290 | +0% $368 | +5% $446 | +10% $524 |
| Rate | -1.0pp $468 | -0.5pp $419 | base $368 | +0.5pp $317 | +1.0pp $265 |
UW: 25.0% down · 7.5% · 30yr · 1.5% tax · 5.0% vac · 8.0% maint · 8.0% mgmt
Financing live
Cash to close
- Down payment
- $49,500
- Closing costs
- $5,940
- Reserves months
- —
- Total cash needed
- —
Loan-product check · same deal, 3 products live
Conventional
25% down · 7.5% · 30yr
- Down + closing
- —
- Monthly P&I
- —
- Monthly cashflow
- —
- DSCR
- —
- Eligible?
- —
Personal DTI + credit; lowest rate.
DSCR
20% down · 8.5% · 30yr
- Down + closing
- —
- Monthly P&I
- —
- Monthly cashflow
- —
- DSCR
- —
- Eligible?
- —
No personal income docs; deal must DSCR.
Hard money
10% down · 12.0% · 12mo
- Down + closing
- —
- Monthly P&I
- —
- Monthly cashflow
- —
- DSCR
- —
- Eligible?
- —
Short-term bridge; refi at stabilization.
Rent comps 1 comps
| Address | Beds | Baths | Sqft | Rent | $/sqft | DOM | Units | Dist |
|---|---|---|---|---|---|---|---|---|
| 102 Highland Dr Benton, KY | 2.0 | 1.0 | 1100 | $1,975 | $1.80 | 45d | 1 | 0.93mi |
Listing history 3 events
-
2026-05-04$198,000 Active 876-char remark
-
2021-12-02soldstatus $144,900 206-char remark
Show marketing remark (206 chars)
Recently Remodeled Home in Benton. 3 Bedrooms, 1 1/2 Bath includes new windows, HVAC, light fixtures, paved driveway, new concrete on carport, and fenced back yard. List price includes seller paid new roof.
-
2021-08-02$144,900 206-char remark
Show marketing remark (206 chars)
Recently Remodeled Home in Benton. 3 Bedrooms, 1 1/2 Bath includes new windows, HVAC, light fixtures, paved driveway, new concrete on carport, and fenced back yard. List price includes seller paid new roof.
ⓘ Source: listings_history table (triggers on properties + properties_extension) + one-shot
backfill from property_details.listing_events for pre-trigger history.
Tax reassessment forecast KY · Resets to sale price
- Current annual tax
- $854 · $71/mo
- Projected year-2 tax
- $1,703 · $142/mo
- Expected delta
- +$849/yr (+$71/mo · 99.5%)
ⓘ Screening estimate from a state-policy table — verify with the county assessor before closing.
Climate risk First Street
- Flood 1/10 Low FEMA zone X (unshaded) · 0% chance over 30 yrs
- Wildfire 4/10 Moderate
- Heat 6/10 Major 7 d/yr ≥109°F today · 21 d/yr by 30 yrs out
- Wind 3/10 Moderate 7% chance of damaging wind over 30 yrs
- Air quality 1/10 Low 0 unhealthy d/yr today · 0 by 30 yrs out
Nearby sold comps map
Loading sold comps map…
Walkable amenities ~0.75 mi
Loading nearby amenities…
Taxation est. · year 1
- Rental income
- $23,700
- − Mortgage interest
- −$11,091
- − Property taxes
- −$854
- − Insurance
- −$990
- − Repairs & maintenance
- −$1,896
- − Management
- −$1,896
- − Depreciation
- −$5,760
- Taxable income
- $1,213
- Est. tax owed @ 24.0%
- −$291
- After-tax cash flow
- $4,128/yr
For passive investors: Depreciation is non-cash, so a rental often shows a tax loss while cash-flowing — sheltering income. Rental losses are passive: they offset passive income freely, and up to $25,000/yr can offset ordinary (W-2) income if you actively participate and your MAGI is under $100k (phasing out to $0 by $150k); unused losses carry forward. On sale, claimed depreciation is recaptured at up to 25%, and gains may owe capital-gains tax (a 1031 exchange can defer both). Figures are a year-1 estimate at your 24.0% rate — not tax advice; consult a CPA.
Schools (NCES district)
- District
- Marshall County
- NCES district ID
- 2103810
- Math proficiency
- 29% ▼ -7.00%
- Reading proficiency
- 38% ▼ -16.00%
- Median HH income
- $45,324
- Composite
- 28.62/100
- National rank
- #6710
- State rank
- #73 of 165 in KY
Livability — Benton
- Score
- 69/100
- State rank
- #171
- US rank
- #8655
Category grades
Schools grade is shown separately in the Schools card above.
Census & demographics
- Census place
- Benton, KY
- Population (ZIP)
- 19,238
Population outlook (Marshall County) Hauer SSP2
- Today (2025)
- 30,647 people
- By 2030
- 30,276 · -1.2%
- By 2040
- 29,232 · -4.6%
- By 2050
- 27,940 · -8.8%
- By 2075
- 25,289 · -17.5%
- By 2100
- 21,188 · -30.9%
Race, ethnicity, and origin ACS 2023
- Neighborhood character
- Predominantly White (95%)
- Race & ethnicity
- White 95% Two or more races 2% Hispanic / Latino 2%
- Common ancestry
- Iranian 2% Slovak 2% Lithuanian 2%
- Foreign-born
- 1% · Canada
- Languages at home
- 98% English-only · Spanish 1%
Political lean MEDSL · Marshall
- 2024 margin
- Solid R (+56.7) · D 21.0% · R 77.7% · Other 1.3%
- 2008→2024 swing
- -32.0pp toward R · 2008: -24.7pp · 2024: -56.7pp
- All cycles
- 2024: R+56.7 2020: R+52.4 2016: R+51.9 2012: R+34.2 2008: R+24.7
Not yet ingested
- Civics
- —
Market trends
- HPI YoY
- ▲ 19.11%
- Current HPI
- 288.75
- Rent YoY
- —
- Metro
- —
- State GDP YoY
- ▲ 1.81%
- F500 in state
- 4
Industry mix (Fortune 500 HQ in KY)
| Industry | F500 HQs | Revenue |
|---|---|---|
| Healthcare | 1 | $118B |
|
||
| Food / Beverage | 1 | $7B |
|
||
Price history
+31.1% since first listed5 events — show timeline
- 2026-06-03 Sold (MLS) $190,000 WKRMLS
- 2026-05-20 Pending — WKRMLS
- 2026-05-04 Listed $198,000 WKRMLS
- 2021-12-02 Sold (MLS) $144,900 WKRMLS
- 2021-08-02 Listed $144,900 WKRMLS
Property tax history
+5.6%/yrLatest (2025): $854 · -4.4% YoY. Source: county tax records.
Cash-flow waterfall
monthlySold comps — $/sqft
last 12 mo · ≤1 miLoading sold comps…