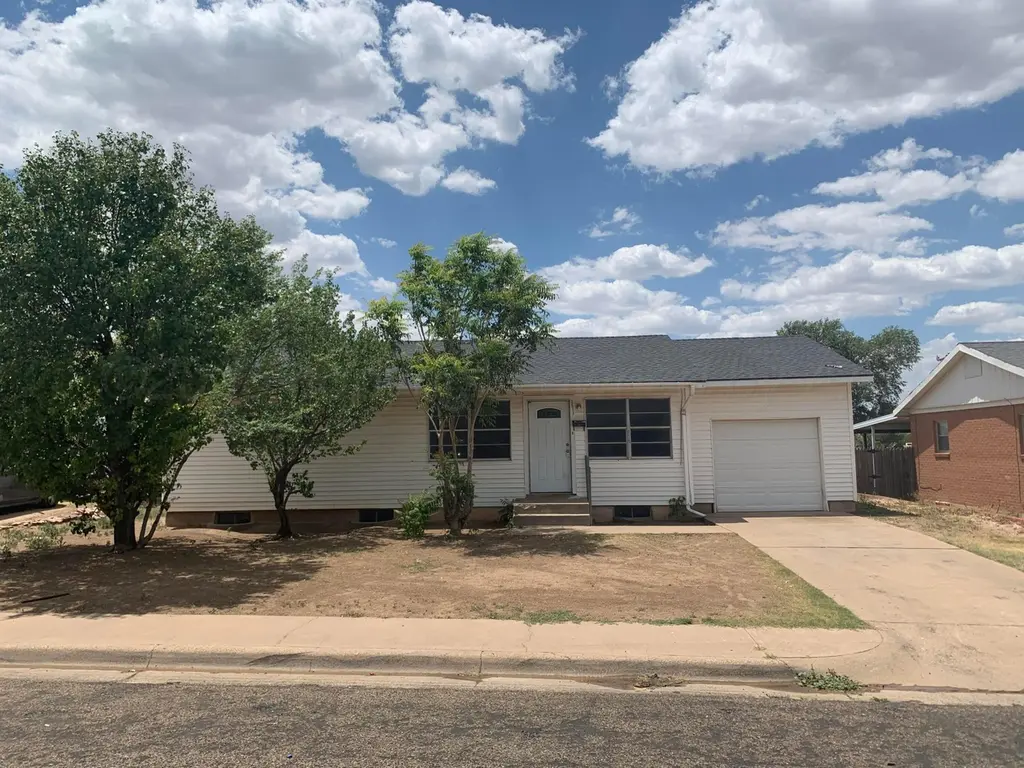
2511 Orange St
Amarillo, TX 79107
$117,000B-
3 bd · 2.0 ba ·
2,052 sqft ·
Built 1958
· SingleFamily
· Active
· 26 DOM
Cashflow @ list (25.0% down · 7.5%)
Estimated rent
$1,685/mo
Mortgage (P&I)
−$614
Tax + insurance
−$214
HOA
−$0
Vac / Maint / Mgmt
−$354
Net cashflow
$504/mo
Annual
$6,051/yr
Cap rate
11.46%
Cash-on-cash
18.47%
DSCR
1.82
1% rule
1.44%
Cash to close
$32,760
Investor read
- This is a 3-bed/2.0-bath single-family listed at $117k.
- At list price, monthly cash flow is $504 ($6k/yr) — positive.
- The deal already cash-flows at list — no discount required.
- Meets the 1% rule at list price ($2k rent vs $117k).
- It's been on market 26 days — a 2% lower offer ($115k) is reasonable based on typical stale-listing flexibility.
- Recommended offer: $115k (1.5% below list) — sets the bar for market timing.
- Local home prices are declining (-3.0%/yr); year-one equity from $809 of loan paydown is wiped out by about $4k of value loss. Plan a longer hold.
- Location reads 66/100 on livability (#624 in TX) — a middle-class / working-renter tenant base. Strengths: cost of living A+, housing A+; Watch: amenities C-, crime F, commute F.
- Amarillo ISD (urban): math 44% / reading 41% proficiency, ranked #336 of 826 in TX (top 41%) — families likely to look elsewhere, expect single-tenant / working-renter base with shorter leases.
- Zoned schools: Hamlet El (math 12% / reading 12%, grade F, #4,207 of 4,322 statewide, top 98%, 295 students, 91% FRL); Mann Middle (math 36% / reading 29%, grade F, #947 of 1,662 statewide, top 58%, 458 students, 92% FRL); Palo Duro H S (math 39% / reading 33%, grade F, #930 of 1,632 statewide, top 57%, 1,923 students, 84% FRL) — zoned schools average 89% FRL vs 58% district-wide (31 pts higher); higher-poverty schools than district average — tighter screening recommended.
- Zoned-school proficiency averages 27% at this address vs 42% district-wide (-16 pts) — the specific schools serving this property underperform the Amarillo ISD average; the district grade overstates school quality for this exact location.
- Watch-outs: built in 1958 — expect roof / HVAC / electrical / plumbing capex.
- Market conditions: 120 active listings in the ZIP; 2 comparable units currently listed for rent nearby; lower-income renter base — watch delinquency; 1,214 units permitted in Potter County in 2024 (650 in 5+ unit buildings).
- 4 sale attempts since 8y ago with the ask held roughly flat each time — persistent listings suggest the price (not the market) is what's stuck; bring a comps-based counter.
- Current owner paid $74k; list at $117k implies a 59% gain — meaningful room to come down on a strong offer.
- At projected returns (-3.0% appreciation + 3.0% rent growth), your $33k cash investment doubles in ~7 years — after that, you're playing with house money.
- Climate carrying-cost: moderate wildfire risk — expect insurance premiums to compound above CPI over the hold.
- At $1,685/mo this rent would consume 50% of the median local household income ($41k/yr) (locally 1019% of renters already pay >50% of income on rent) — very limited rent-growth headroom before tenants either downsize or default.
Questions for listing agent
- Built in 1958 — when were the roof, HVAC, electrical panel, plumbing, and water heater last replaced?
- Is there a deadline driving the sale (1031 exchange, divorce, estate, relocation)? That informs how much negotiation room exists.
- Schools are D-rated, which usually means shorter tenancies and higher turnover. Who's the typical renter profile here, and what's been the actual vacancy rate?
- Crime grade is F in this area — have there been break-ins, vandalism, or insurance claims at this property in the last 3 years? What carrier currently insures it and at what premium?
- What's the average days-on-market for RENTAL listings here right now (not sales)? A rising rental-DOM trend means longer vacancies and softer asking-rent achievability than the comps imply.
- What's the recent tenant-quality profile in this submarket — average credit score on applications, eviction rate, late-payment / NSF rate, and stable-employment percentage? A property-management company in the area should have these aggregated.
- How much new for-sale + rental construction is in the pipeline within 1–3 miles? Heavy new supply typically softens prices + rents 12–24 months out; constrained supply supports both.
CashFlowRE · CFR-GYFHC6BFCCYDFC
· Data 3 days ago
cashflowre.app · 2026-05-29