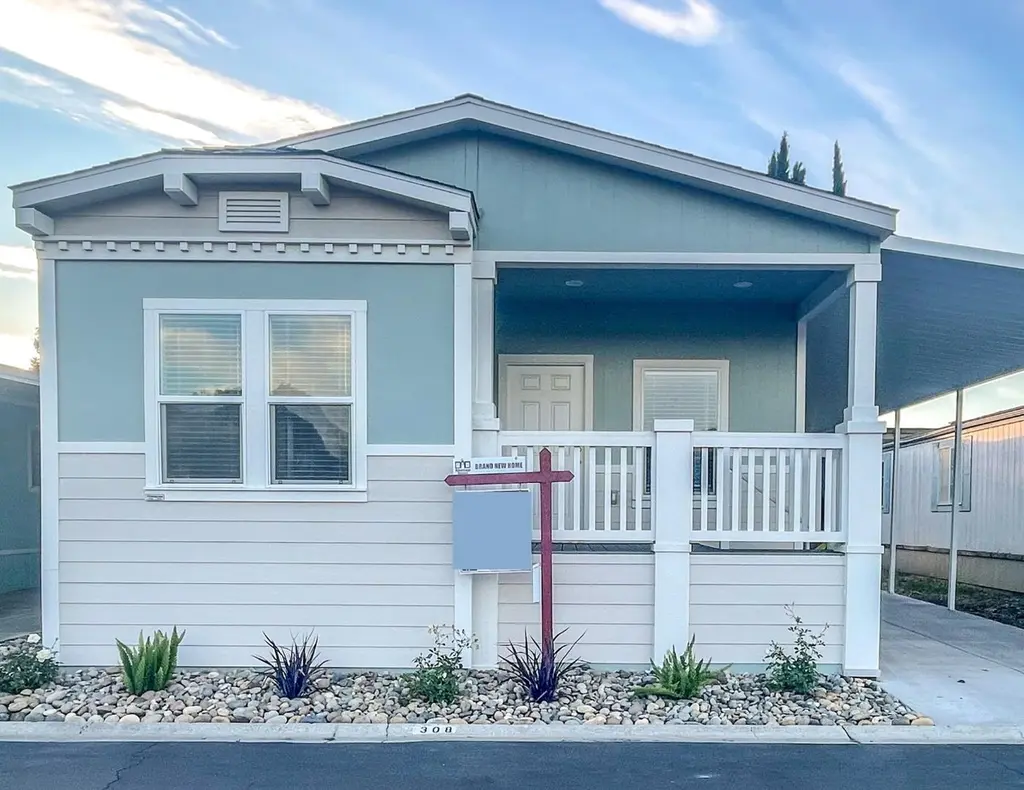
2151 Oakland Rd #308
San Jose, CA 95131
$309,900B-
3 bd · 2.0 ba ·
1,550 sqft ·
Built 2023
· Manufactured
· Active
· 21 DOM
Cashflow @ list (25.0% down · 7.5%)
Estimated rent
$4,377/mo
Mortgage (P&I)
−$1,625
Tax + insurance
−$516
HOA
−$0
Vac / Maint / Mgmt
−$919
Net cashflow
$1,316/mo
Annual
$15,794/yr
Cap rate
11.39%
Cash-on-cash
18.20%
DSCR
1.81
1% rule
1.41%
Cash to close
$86,772
Investor read
- This is a 3-bed/2.0-bath manufactured listed at $310k. Condition is rated fair.
- At list price, monthly cash flow is $1k ($16k/yr) — positive.
- The deal already cash-flows at list — no discount required.
- Meets the 1% rule at list price ($4k rent vs $310k).
- It's been on market 21 days — a 2% lower offer ($305k) is reasonable based on typical stale-listing flexibility.
- Recommended offer: $305k (1.5% below list) — sets the bar for market timing.
- Local home prices are declining (-3.0%/yr); year-one equity from $2k of loan paydown is wiped out by about $9k of value loss. Plan a longer hold.
- Location reads 78/100 on livability (#68 in CA, #2,559 nationally) — a middle-class / working-renter tenant base. Strengths: amenities A+, commute A+, employment A+; Watch: crime F, cost of living F.
- Orchard Elementary (urban): math 51% / reading 60% proficiency, ranked #225 of 1,400 in CA (top 16%) — acceptable for families but not a draw, mixed tenant base, ~2y average lease.
- Zoned schools: Orchard Elementary (763 students, 44% FRL); Evergreen Valley High (math 76% / reading 83%, grade A-, #45 of 1,170 statewide, top 4%, 2,767 students, 13% FRL).
- Zoned-school proficiency averages 80% at this address vs 56% district-wide (+24 pts) — the actual schools serving this property are materially stronger than the Orchard Elementary average implies; a family-tenant draw the district grade alone would hide.
- Market conditions: Rents rising fast (+4.7%/yr); 48 active listings in the ZIP; 40 comparable units currently listed for rent nearby; rentals leasing fast (median 9d on market — plan ~1-2 weeks tenant-placement turnaround); high-income renter base; 3,838 units permitted in Santa Clara County in 2024 (1,886 in 5+ unit buildings).
- Santa Clara County population projected at +24% by 2050 — long-run rental-demand tailwind backs the buy-and-hold thesis.
- At projected returns (-3.0% appreciation + 4.7% rent growth), your $87k cash investment doubles in ~6 years — after that, you're playing with house money.
- Cap rate 11.4% vs local median 1.6% in San Jose — top-decile yield for the area; either an underpriced asset or a hidden risk that comps aren't pricing in. Stress-test before assuming the spread holds.
- This rent runs 31% of the median local income ($170k/yr) — at the standard rent-burdened threshold; future hikes will face affordability resistance.
Questions for listing agent
- Have any recent inspections been done? Can we get a copy of the seller's disclosures and any deferred-maintenance estimates?
- Is there a deadline driving the sale (1031 exchange, divorce, estate, relocation)? That informs how much negotiation room exists.
- Crime grade is F in this area — have there been break-ins, vandalism, or insurance claims at this property in the last 3 years? What carrier currently insures it and at what premium?
- What's the average days-on-market for RENTAL listings here right now (not sales)? A rising rental-DOM trend means longer vacancies and softer asking-rent achievability than the comps imply.
- What's the recent tenant-quality profile in this submarket — average credit score on applications, eviction rate, late-payment / NSF rate, and stable-employment percentage? A property-management company in the area should have these aggregated.
- How much new for-sale + rental construction is in the pipeline within 1–3 miles? Heavy new supply typically softens prices + rents 12–24 months out; constrained supply supports both.
Repairs flagged (vision-AI assessment)
- Minor: Paint — No visible signs of recent painting
- Minor: Landscaping — Low maintenance plants and river rocks present
CashFlowRE · CFR-GYTF30C31SJ4NN
· Data 3 weeks ago
cashflowre.app · 2026-05-29