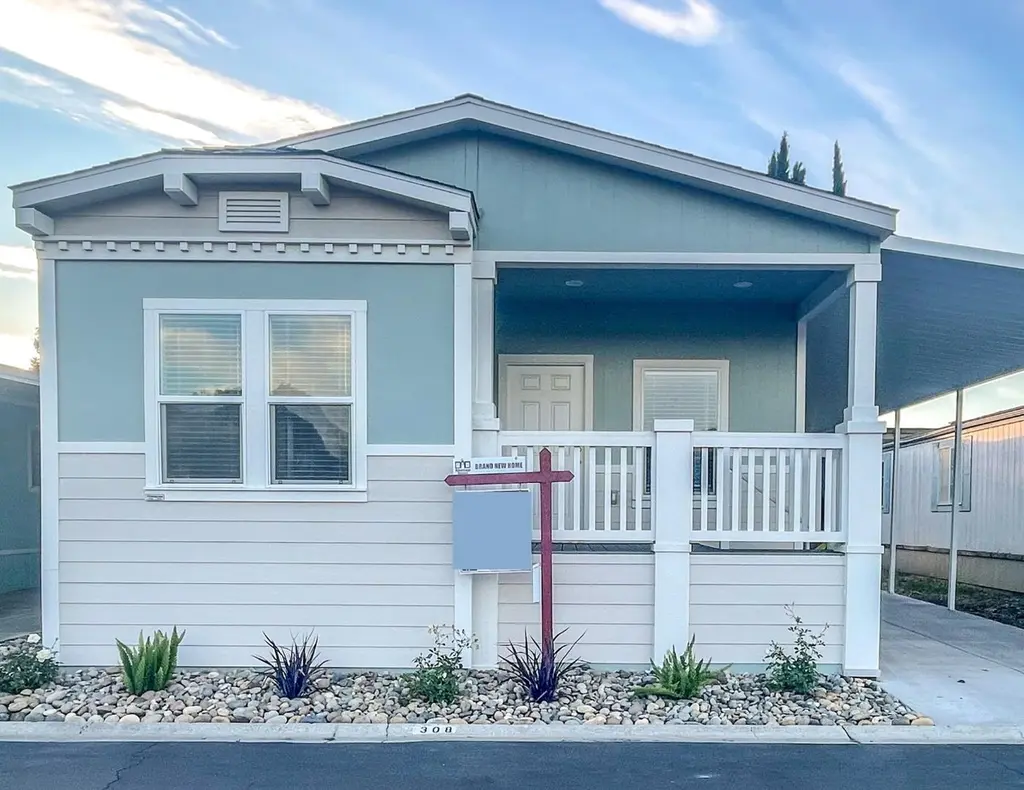
2151 Oakland Rd #308 · San Jose, CA
Flood risk No data
- FEMA flood zone
- —
- Chance of flooding over 30 yrs
- —
- Est. flood insurance / yr
- —
Fire risk No data
- Est. fire insurance / yr
- —
Heat risk No data
- Hot days now (above threshold)
- —
- Hot days in 30 yrs
- —
Wind risk No data
- Chance of severe wind over 30 yrs
- —
Air-quality risk No data
- Unhealthy air days now
- —
- Unhealthy air days in 30 yrs
- —
Risk factors via First Street. Map © Google.
Why this score? — see what drove the B- grade
The composite is a weighted blend of 9 inputs, each scored 0–100. Each bar is that input's sub-score; the figure is the points it added to the 100-point composite (weight × sub-score).
- Cash flow +30.0/30.0
- DSCR +10.0/10.0
- 1% rule +9.1/10.0
- Schools +5.5/10.0
- ARV discount +3.9/15.0
- Livability +3.9/5.0
- Rent growth +3.7/5.0
- Condition / age +2.2/5.0
- Appreciation +0.0/10.0
$309,900
🖨 Deal sheet (PDF) 📄 Offer letter ✓ Due diligence
Listing remarks
This stunning three-bedroom, two-bathroom Golden West home is located in the family-friendly community of Casa Del Lago. Upon entering this beautiful home, you'll immediately notice the spacious open floor plan, highlighted by the updated LED recessed lights in the living room. The kitchen boasts elegant countertops, complemented by beautiful white cabinetry and name brand stainless-steel appliances. The primary bedroom features a large walk-in closet, as well as a primary bathroom with a dual vanity. The home's exterior benefits from expertly crafted landscaping, with low maintenance plants and gorgeous river rocks adding to its charm. The property includes a large carport that can accommo
Key facts
- Open floor plan
- Elegant countertops
- Dual vanity
Tags
Property features AI
Finance
- HOA & community: Community pool; Indoor half basketball court; Billiard room; Gym / exercise facility; Tennis court
Exterior
- Parking: Carport (space #308, rented separately)
- Utilities: Public water; Public sewer; Public utilities
- Home design: Leased land (park home site)
- Exterior features: Composition roof
Interior
- Kitchen: Dishwasher; Oven/Range; Refrigerator
- Bedrooms: 3 bedrooms
- Bathrooms: 2 full bathrooms
- Heating & cooling: Central forced air heating
- Interior features: Dining area (no formal dining room); Island in kitchen; Garbage disposal; Shower and tub
- Laundry & utility: Washer/dryer hookups only
Neighborhood map
What this means for you Summary
Snapshot
- This is a 3-bed/2.0-bath manufactured listed at $310k. Condition is rated fair.
Deal economics
- At list price, monthly cash flow is $1k ($16k/yr) — positive.
- The deal already cash-flows at list — no discount required.
- Meets the 1% rule at list price ($4k rent vs $310k).
- Recommended offer: $305k (1.5% below list) — sets the bar for market timing.
- Cap rate 11.4% vs local median 1.6% in San Jose — top-decile yield for the area; either an underpriced asset or a hidden risk that comps aren't pricing in. Stress-test before assuming the spread holds.
Location & tenants
- Location reads 78/100 on livability (#68 in CA, #2,559 nationally) — a middle-class / working-renter tenant base. Strengths: amenities A+, commute A+, employment A+; Watch: crime F, cost of living F.
- Orchard Elementary (urban): math 51% / reading 60% proficiency, ranked #225 of 1,400 in CA (top 16%) — acceptable for families but not a draw, mixed tenant base, ~2y average lease.
- Zoned schools: Orchard Elementary (763 students, 44% FRL); Evergreen Valley High (math 76% / reading 83%, grade A-, #45 of 1,170 statewide, top 4%, 2,767 students, 13% FRL).
- Zoned-school proficiency averages 80% at this address vs 56% district-wide (+24 pts) — the actual schools serving this property are materially stronger than the Orchard Elementary average implies; a family-tenant draw the district grade alone would hide.
- Market conditions: Rents rising fast (+4.7%/yr); 48 active listings in the ZIP; 40 comparable units currently listed for rent nearby; rentals leasing fast (median 9d on market — plan ~1-2 weeks tenant-placement turnaround); high-income renter base; 3,838 units permitted in Santa Clara County in 2024 (1,886 in 5+ unit buildings).
- This rent runs 31% of the median local income ($170k/yr) — at the standard rent-burdened threshold; future hikes will face affordability resistance.
Forward outlook
- Local home prices are declining (-3.0%/yr); year-one equity from $2k of loan paydown is wiped out by about $9k of value loss. Plan a longer hold.
- Santa Clara County population projected at +24% by 2050 — long-run rental-demand tailwind backs the buy-and-hold thesis.
- At projected returns (-3.0% appreciation + 4.7% rent growth), your $87k cash investment doubles in ~6 years — after that, you're playing with house money.
Negotiation context
- It's been on market 21 days — a 2% lower offer ($305k) is reasonable based on typical stale-listing flexibility.
Questions for the listing agent
- Have any recent inspections been done? Can we get a copy of the seller's disclosures and any deferred-maintenance estimates?
- Is there a deadline driving the sale (1031 exchange, divorce, estate, relocation)? That informs how much negotiation room exists.
- Crime grade is F in this area — have there been break-ins, vandalism, or insurance claims at this property in the last 3 years? What carrier currently insures it and at what premium?
- What's the average days-on-market for RENTAL listings here right now (not sales)? A rising rental-DOM trend means longer vacancies and softer asking-rent achievability than the comps imply.
- What's the recent tenant-quality profile in this submarket — average credit score on applications, eviction rate, late-payment / NSF rate, and stable-employment percentage? A property-management company in the area should have these aggregated.
- How much new for-sale + rental construction is in the pipeline within 1–3 miles? Heavy new supply typically softens prices + rents 12–24 months out; constrained supply supports both.
Investment metrics
- 1% rule
- 1.41% ✓
- Cap rate
- 11.39%
- Cash-on-cash
- 18.20%
- DSCR
- 1.81
- GRM
- 5.9
CMA / ARV
- ARV (median comp)
- $287,041
- List price
- $309,900
- Delta
- 7.96%
- Verdict
- FAIR
- Comps
- 17 within 1.0 mi
Show comp detail 12 sales within ~0.75 mi
| Address | Dist | Beds/Ba | Sqft | Sold | Price | $/sf | Match |
|---|---|---|---|---|---|---|---|
| 2151 Oakland Rd #210 | 0.00mi | 3/2.0 | 1,516 (-2%) | 7mo | $235,000 | $155 | 91 |
| 2151 Oakland Rd Space #46 | 0.15mi | 3/2.0 | 1,536 (-1%) | 5mo | $315,000 | $205 | 88 |
| 2151 Oakland Rd #552 | 0.15mi | 3/2.0 | 1,485 (-4%) | 3mo | $310,000 | $209 | 83 |
| 2151 Oakland Rd #189 | 0.00mi | 3/2.0 | 1,440 (-7%) | 6mo | $320,000 | $222 | 83 |
| 2151 Oakland Rd #375 | 0.01mi | 3/2.0 | 1,630 (+5%) | 10mo | $395,000 | $242 | 83 |
| 2151 Oakland Rd #14 | 0.00mi | 3/2.0 | 1,440 (-7%) | 7mo | $291,500 | $202 | 82 |
| 2151 Oakland Rd #444 | 0.01mi | 2/2.0 (-1) | 1,488 (-4%) | 9mo | $200,000 | $134 | 81 |
| 2151 Oakland Rd #135 | 0.01mi | 2/2.0 (-1) | 1,440 (-7%) | 3mo | $310,000 | $215 | 80 |
| 2151 Oakland #229 | 0.15mi | 4/2.0 (+1) | 1,440 (-7%) | 1mo | $344,000 | $239 | 75 |
| 2151 Oakland Rd #595 | 0.15mi | 3/2.0 | 1,410 (-9%) | 4mo | $220,000 | $156 | 75 |
| 2151 Oakland Rd #231 | 0.33mi | 3/2.0 | 1,440 (-7%) | 8mo | $260,000 | $181 | 66 |
| 2151 Oakland Rd #443 | 0.15mi | 2/2.0 (-1) | 1,344 (-13%) | 3mo | $229,900 | $171 | 64 |
Match score weights: distance 35% · size 25% · config 20% · recency 20%. Top-matched comps best support the ARV.
Projected returns pro-forma
-3.0% appreciation · 4.67% rent growth · sell at horizon
- IRR
- 11.7%
- Equity multiple
- 1.47×
- Total profit
- $41,154
- Equity at exit
- $46,207
- IRR
- 22.0%
- Equity multiple
- 3.03×
- Total profit
- $175,793
- Equity at exit
- $26,794
Cash invested: $86,772 (down + closing). Projections, not guarantees.
Landlord ↔ Tenant lean methodology
- Overall (CITY)
- 0 Strongly Tenant-Friendly
- State California
- 18 Strongly Tenant-Friendly · D+13
- County
- — inherits STATE
- City San Jose
- 0 Strongly Tenant-Friendly · D+24
ZIP-level market 95131
- Rents YoY
- 4.7%
- Active inventory
- 48
- Price-to-rent
- 5.9×
Monthly cashflow live
- Estimated rent
- $4,377 high interval (Pro) →
- Mortgage (P&I)
- −$1,625
- Tax est. 1.5%
- −$387 /mo · $4,648/yr
- Insurance
- −$129
- HOA
- −$0
- Vacancy / Maint / Mgmt
- −$919
- Net cashflow
- $1,316
Break-even live
Sensitivity live
| Price | -10% $1,530 | -5% $1,423 | +0% $1,316 | +5% $1,209 | +10% $1,102 |
|---|---|---|---|---|---|
| Rent | -10% $970 | -5% $1,143 | +0% $1,316 | +5% $1,489 | +10% $1,662 |
| Rate | -1.0pp $1,472 | -0.5pp $1,395 | base $1,316 | +0.5pp $1,236 | +1.0pp $1,154 |
UW: 25.0% down · 7.5% · 30yr · 1.5% tax · 5.0% vac · 8.0% maint · 8.0% mgmt
Financing live
Cash to close
- Down payment
- $77,475
- Closing costs
- $9,297
- Reserves months
- —
- Total cash needed
- —
Loan-product check · same deal, 3 products live
Conventional
25% down · 7.5% · 30yr
- Down + closing
- —
- Monthly P&I
- —
- Monthly cashflow
- —
- DSCR
- —
- Eligible?
- —
Personal DTI + credit; lowest rate.
DSCR
20% down · 8.5% · 30yr
- Down + closing
- —
- Monthly P&I
- —
- Monthly cashflow
- —
- DSCR
- —
- Eligible?
- —
No personal income docs; deal must DSCR.
Hard money
10% down · 12.0% · 12mo
- Down + closing
- —
- Monthly P&I
- —
- Monthly cashflow
- —
- DSCR
- —
- Eligible?
- —
Short-term bridge; refi at stabilization.
Rent comps 40 comps
| Address | Beds | Baths | Sqft | Rent | $/sqft | DOM | Units | Dist |
|---|---|---|---|---|---|---|---|---|
| 2195 Klassen Way #1539 San Jose, CA | 3.0 | 2.5 | 1892 | $3,440 | $1.82 | 0d | 1 | 0.15mi |
| 1141 Rock Ave San Jose, CA | 3.0 | 2.5 | 1376 | $4,295 | $3.12 | 0d | 1 | 0.16mi |
| 1799 Snell Pl Milpitas, CA | 3.0 | 3.0 | 1450 | $4,450 | $3.07 | 18d | 1 | 0.62mi |
| 69 Ede Ln Milpitas, CA | 3.0 | 3.0 | 1253 | $4,128 | $3.29 | 9d | 1 | 0.69mi |
| 1067 McKay Dr San Jose, CA | 3.0 | 3.0 | 1657 | $4,800 | $2.90 | 0d | 1 | 0.71mi |
| 363 Odyssey Ln Milpitas, CA | 3.0 | 4.0 | 1651 | $4,750 | $2.88 | 0d | 1 | 0.71mi |
| 1694 Starlite Dr Milpitas, CA | 4.0 | 2.5 | 1726 | $4,600 | $2.67 | 0d | 1 | 0.74mi |
| 2031 Trento Loop Milpitas, CA | 3.0 | 3.0 | 1709 | $4,400 | $2.57 | 9d | 1 | 0.77mi |
| 212 Houret Dr Milpitas, CA | 3.0 | 3.5 | 2200 | $4,900 | $2.23 | 0d | 1 | 0.80mi |
| 1753 Capulet Dr Milpitas, CA | 2.0 | 2.0 | 1100 | $4,000 | $3.64 | 17d | 1 | 0.81mi |
| 1573 Capulet Dr Milpitas, CA | 2.0 | 2.0 | 1100 | $3,750 | $3.41 | 23d | 1 | 0.81mi |
| 225 Houret Dr Milpitas, CA | 3.0 | 3.5 | 2035 | $4,700 | $2.31 | 45d | 1 | 0.83mi |
| 23 Cedar Way Milpitas, CA | 4.0 | 2.0 | 1527 | $4,620 | $3.03 | 9d | 1 | 0.86mi |
| 379 Lundy Pl Milpitas, CA | 3.0 | 3.0 | 1618 | $4,445 | $2.75 | 9d | 1 | 0.87mi |
| 56 Lonetree Ct Milpitas, CA | 4.0 | 2.5 | 1824 | $5,000 | $2.74 | 20d | 1 | 0.88mi |
| 1677 Centre Pointe Dr Milpitas, CA | 3.0 | 3.0 | 1687 | $4,600 | $2.73 | 25d | 1 | 0.94mi |
| 1331 Lakeshore Cir San Jose, CA | 1.0–3.0 | 1.0–3.0 | 1017 | $4,759 | $4.68 | 0d | 28 | 0.96mi |
| 1600 Whitewood Dr San Jose, CA | 1.0–2.0 | 1.0–2.0 | 977 | $3,871 | $3.96 | 0d | 11 | 0.97mi |
| 460 Montague Expy #40 Milpitas, CA | 3.0 | 2.5 | 1833 | $4,750 | $2.59 | 3d | 1 | 0.98mi |
| 460 Montague Expy #40 Milpitas, CA | 3.0 | 2.5 | 1833 | $4,750 | $2.59 | 0d | 1 | 0.98mi |
| 1625 Delano St Unit 31A Milpitas, CA | 3.0 | 2.5 | 1458 | $4,295 | $2.95 | 0d | 1 | 0.99mi |
| 312 Gates Dr Milpitas, CA | 1.0–2.0 | 1.0–2.0 | 891 | $4,580 | $5.14 | 0d | 15 | 0.99mi |
| 600 Epic Way San Jose, CA | 2.0 | 1.0–2.0 | 832 | $4,847 | $5.82 | 0d | 25 | 1.01mi |
| 650 E Capitol Ave Milpitas, CA | 1.0–2.0 | 1.0–2.0 | 1003 | $4,835 | $4.82 | 0d | 17 | 1.04mi |
| 273 Baja Rose St Milpitas, CA | 3.0 | 2.0 | 1569 | $4,700 | $3.00 | 25d | 1 | 1.04mi |
| 1052 Bigleaf Pl #106 San Jose, CA | 4.0 | 4.0 | 2243 | $5,395 | $2.41 | 9d | 1 | 1.12mi |
| 1201 S Main St Milpitas, CA | 2.0 | 2.0 | 1112 | $4,342 | $3.90 | 0d | 1 | 1.12mi |
| 1087 Bigleaf Pl #1526 San Jose, CA | 3.0 | 3.0 | 1850 | $4,180 | $2.26 | 0d | 1 | 1.12mi |
| 2100 Beech Cir San Jose, CA | 3.0 | 3.5 | 1812 | $4,350 | $2.40 | 12d | 1 | 1.13mi |
| 425 Navaro Way #120 San Jose, CA | 2.0 | 2.0 | 1088 | $3,750 | $3.45 | 45d | 1 | 1.13mi |
| 2365 Fallingtree Dr San Jose, CA | 4.0 | 2.0 | 1234 | $4,315 | $3.50 | 13d | 1 | 1.17mi |
| 440 Navaro Pl San Jose, CA | 2.0 | 2.0 | 1254 | $3,924 | $3.13 | 25d | 1 | 1.18mi |
| 345 Village Center Dr San Jose, CA | 2.0 | 1.0–2.0 | 877 | $4,541 | $5.17 | 0d | 17 | 1.22mi |
| 415 Camille Cir San Jose, CA | 2.0 | 2.5 | 1561 | $4,009 | $2.57 | 13d | 1 | 1.24mi |
| 405 Camille Cir San Jose, CA | 3.0 | 3.0 | 2029 | $5,070 | $2.50 | 46d | 1 | 1.24mi |
| 753 Montague Expy Milpitas, CA | 1.0–2.0 | 1.0–2.0 | 862 | $3,970 | $4.61 | 0d | 4 | 1.25mi |
| 1102 S Abel St Milpitas, CA | 3.0 | 1.0–2.0 | 1002 | $4,657 | $4.65 | 0d | 10 | 1.26mi |
| 408 Capella Way Milpitas, CA | 4.0 | 2.5 | 2008 | $4,625 | $2.30 | 0d | 1 | 1.27mi |
| 1323 Pebble Ct San Jose, CA | 2.0 | 2.0 | 1093 | $3,500 | $3.20 | 18d | 1 | 1.44mi |
| 792 Garden St Milpitas, CA | 3.0 | 2.5 | 1997 | $4,400 | $2.20 | 18d | 1 | 1.45mi |
Listing history 5 events
-
2026-05-05$309,900 Active 1104-char remark
-
2026-05-05$309,900 Active 1104-char remark
-
2026-02-10historical
-
2025-09-24price
-
2025-09-17Active
ⓘ Source: listings_history table (triggers on properties + properties_extension) + one-shot
backfill from property_details.listing_events for pre-trigger history.
Nearby sold comps map
Loading sold comps map…
Walkable amenities ~0.75 mi
Loading nearby amenities…
Taxation est. · year 1
- Rental income
- $52,524
- − Mortgage interest
- −$17,359
- − Property taxes
- −$4,648
- − Insurance
- −$1,550
- − Repairs & maintenance
- −$4,202
- − Management
- −$4,202
- − Depreciation
- −$9,015
- Taxable income
- $11,548
- Est. tax owed @ 24.0%
- −$2,771
- After-tax cash flow
- $13,023/yr
For passive investors: Depreciation is non-cash, so a rental often shows a tax loss while cash-flowing — sheltering income. Rental losses are passive: they offset passive income freely, and up to $25,000/yr can offset ordinary (W-2) income if you actively participate and your MAGI is under $100k (phasing out to $0 by $150k); unused losses carry forward. On sale, claimed depreciation is recaptured at up to 25%, and gains may owe capital-gains tax (a 1031 exchange can defer both). Figures are a year-1 estimate at your 24.0% rate — not tax advice; consult a CPA.
Condition & rehab AI · 1 photo
The home requires moderate renovations, focusing on exterior painting and landscaping to improve its curb appeal and overall condition.
Repairs flagged
- Minor Paint — No visible signs of recent painting
- Minor Landscaping — Low maintenance plants and river rocks present
Value-add opportunities
- Both Paint exterior and interior — Fresh paint can significantly improve curb appeal and interior aesthetics
- Both Landscaping — Upgrading landscaping can enhance curb appeal and attract potential buyers/tenants
Renovation cost estimate screening
| Repair item | Severity | Est. cost |
|---|---|---|
| Paint · No visible signs of recent painting | Minor | $500–3,000 |
| Landscaping · Low maintenance plants and river rocks present | Minor | $500–3,000 |
| Total estimated repair cost · 2 items | $1,000–6,000 |
Value-add ROI direction
- Both Paint exterior and interior — Fresh paint can significantly improve curb appeal and interior aesthetics ↑
- Both Landscaping — Upgrading landscaping can enhance curb appeal and attract potential buyers/tenants ↑
ⓘ Cost ranges are severity-bucket heuristics (US national rule-of-thumb). Get contractor quotes + a written scope before underwriting a rehab budget.
Schools (NCES district)
- District
- Orchard Elementary
- NCES district ID
- 0628680
- Math proficiency
- 51% ▲ 1.00%
- Reading proficiency
- 60% ▲ 5.00%
- Median HH income
- $108,165
- Composite
- 54.67/100
- National rank
- #2853
- State rank
- #225 of 1400 in CA
Livability — San Jose
- Score
- 78/100
- State rank
- #68
- US rank
- #2559
Category grades
Schools grade is shown separately in the Schools card above.
Census & demographics
- Census place
- San Jose, CA
- County
- Santa Clara County · 1,806,974 people
- City population
- 954,479
- Metro
- San Jose-Sunnyvale-Santa Clara, CA
- Population (ZIP)
- 31,179
- Household income
- $170,255
- Rent vs Own
- Severe rent burden
- 691.0
Population outlook (Santa Clara County) Hauer SSP2
- Today (2025)
- 2,179,074 people
- By 2030
- 2,301,297 · +5.6%
- By 2040
- 2,528,195 · +16.0%
- By 2050
- 2,712,135 · +24.5%
- By 2075
- 2,998,701 · +37.6%
- By 2100
- 2,931,429 · +34.5%
Race, ethnicity, and origin ACS 2023
- Neighborhood character
- Predominantly Asian (70%)
- Race & ethnicity
- Asian 70% Hispanic / Latino 16% White 10% Two or more races 9% Black 1%
- Hispanic origin (detail)
- Mexican 14%
- Common ancestry
- Italian 1%
- Foreign-born
- 57% · China, Vietnam, Canada
- Languages at home
- 31% English-only · Chinese 28% Vietnamese 11% Spanish 10%
Political lean MEDSL · Santa Clara
- 2024 margin
- Solid D (+40.0) · D 68.1% · R 28.1% · Other 3.8%
- 2008→2024 swing
- -0.9pp no change · 2008: 40.9pp · 2024: 40.0pp
- All cycles
- 2024: D+40.0 2020: D+47.4 2016: D+52.5 2012: D+42.1 2008: D+40.9
Not yet ingested
- Civics
- —
Market trends
- HPI YoY
- ▼ -1287.10%
- Current HPI
- 314.6879
- Rent YoY
- ▲ 4.67%
- Metro
- San Jose-Sunnyvale-Santa Clara, CA
- State GDP YoY
- ▲ 3.21%
- F500 in state
- 116
Industry mix (Fortune 500 HQ in CA)
| Industry | F500 HQs | Revenue |
|---|---|---|
| Technology | 27 | $1,492B |
|
||
| Financial Services | 3 | $174B |
|
||
| Retail | 3 | $44B |
|
||
| Insurance | 3 | $26B |
|
||
| Media / Entertainment | 2 | $115B |
|
||
| Pharmaceuticals / Biotech | 2 | $62B |
|
||
Cash-flow waterfall
monthlySold comps — $/sqft
last 12 mo · ≤1 miLoading sold comps…