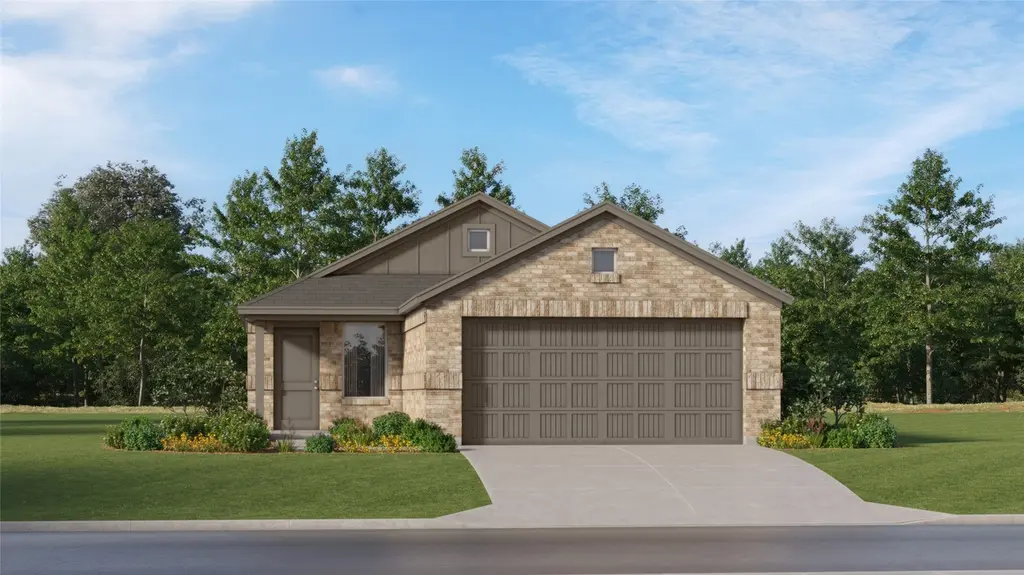
31408 Pratola Serra Cir
Plum Grove, TX 77336
$183,990D+
3 bd · 2.0 ba ·
1,461 sqft ·
Built 2026
· SingleFamily
· Pending
· 8 DOM
Cashflow @ list (25.0% down · 7.5%)
Estimated rent
$2,010/mo
Mortgage (P&I)
−$965
Tax + insurance
−$307
HOA
−$192
Vac / Maint / Mgmt
−$422
Net cashflow
$124/mo
Annual
$1,482/yr
Cap rate
7.10%
Cash-on-cash
2.88%
DSCR
1.13
1% rule
1.09%
Cash to close
$51,544
Investor read
- This is a 3-bed/2.0-bath single-family listed at $184k. Condition is rated good.
- At list price, monthly cash flow is $124 ($1k/yr) — positive.
- The deal already cash-flows at list — no discount required.
- Meets the 1% rule at list price ($2k rent vs $184k).
- Only 8 days on market — expect competitive offers; lowballing is unlikely to land.
- Local home prices are declining (-3.0%/yr); year-one equity from $1k of loan paydown is wiped out by about $6k of value loss. Plan a longer hold.
- Location reads 58/100 on livability (#1,206 in TX) — a working-class tenant base; expect higher turnover. Strengths: crime A+, cost of living A+, housing A+; Watch: amenities F, commute F, health & safety F.
- Huffman ISD (rural): math 32% / reading 35% proficiency, ranked #500 of 826 in TX (top 60%) — families likely to look elsewhere, expect single-tenant / working-renter base with shorter leases.
- Zoned schools: Falcon Ridge El (math 30% / reading 35%, grade F, #2,234 of 4,322 statewide, top 52%, 689 students, 49% FRL); Huffman Middle (math 36% / reading 32%, grade F, #892 of 1,662 statewide, top 55%, 907 students, 42% FRL); Hargrave H S (math 31% / reading 46%, grade F, #866 of 1,632 statewide, top 54%, 1,125 students, 36% FRL).
- Market conditions: 587 active listings in the ZIP; 2 comparable units currently listed for rent nearby; solid renter incomes; 29,883 units permitted in Harris County in 2024 (8,621 in 5+ unit buildings).
- Harris County population projected at +47% by 2050 — long-run rental-demand tailwind backs the buy-and-hold thesis.
- 2 sale attempts with the ask held roughly flat each time — persistent listings suggest the price (not the market) is what's stuck; bring a comps-based counter.
- Cap rate 7.1% vs local median 5.0% in Plum Grove — top-decile yield for the area; either an underpriced asset or a hidden risk that comps aren't pricing in. Stress-test before assuming the spread holds.
Questions for listing agent
- What does the HOA fee cover, when was the last increase, and are there any pending special assessments or reserve-fund shortfalls?
- Is there a deadline driving the sale (1031 exchange, divorce, estate, relocation)? That informs how much negotiation room exists.
- Schools are F-rated, which usually means shorter tenancies and higher turnover. Who's the typical renter profile here, and what's been the actual vacancy rate?
- The area grade is low — what's the realistic commute time and amenity access for the typical tenant pool here? Any planned neighborhood developments (good or bad) we should know about?
- What's the average days-on-market for RENTAL listings here right now (not sales)? A rising rental-DOM trend means longer vacancies and softer asking-rent achievability than the comps imply.
- What's the recent tenant-quality profile in this submarket — average credit score on applications, eviction rate, late-payment / NSF rate, and stable-employment percentage? A property-management company in the area should have these aggregated.
- How much new for-sale + rental construction is in the pipeline within 1–3 miles? Heavy new supply typically softens prices + rents 12–24 months out; constrained supply supports both.
CashFlowRE · CFR-GZ3DDVE0TKVF9Q
· Data 3 weeks ago
cashflowre.app · 2026-05-29