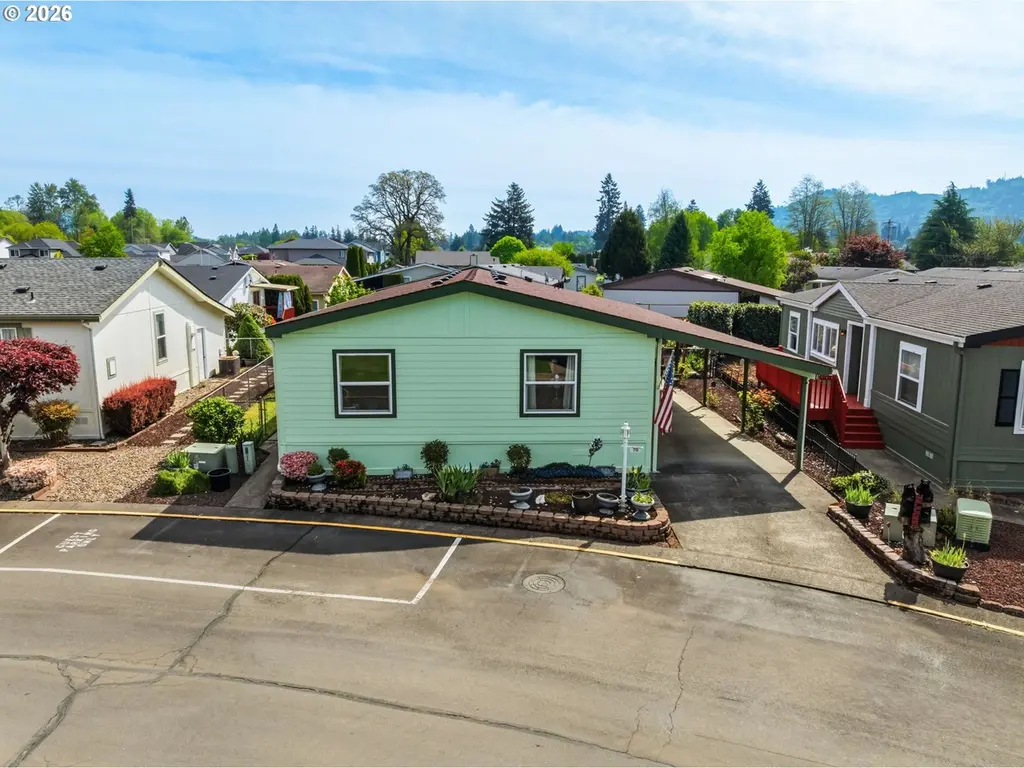
369 Gun Club Rd #79
Woodland, WA 98674
$105,000B+
3 bd · 2.0 ba ·
1,782 sqft ·
Built 1994
· Manufactured
· Active
· 48 DOM
Cashflow @ list (25.0% down · 7.5%)
Estimated rent
$2,670/mo
Mortgage (P&I)
−$551
Tax + insurance
−$546
HOA
−$0
Vac / Maint / Mgmt
−$561
Net cashflow
$1,013/mo
Annual
$12,152/yr
Cap rate
22.74%
Cash-on-cash
58.74%
DSCR
3.61
1% rule
2.54%
Cash to close
$29,400
Investor read
- This is a 3-bed/2.0-bath manufactured listed at $105k.
- At list price, monthly cash flow is $1k ($12k/yr) — positive.
- The deal already cash-flows at list — no discount required.
- Meets the 1% rule at list price ($3k rent vs $105k).
- It's been on market 48 days — a 3% lower offer ($102k) is reasonable based on typical stale-listing flexibility.
- Recommended offer: $102k (3.0% below list) — sets the bar for market timing.
- Local home prices are declining (-3.0%/yr); year-one equity from $726 of loan paydown is wiped out by about $3k of value loss. Plan a longer hold.
- Location reads 77/100 on livability (#152 in WA, #3,252 nationally) — a middle-class / working-renter tenant base. Strengths: housing A+, health & safety A+, amenities B+; Watch: commute F.
- Woodland School District (town): math 48% / reading 62% proficiency, ranked #94 of 291 in WA (top 32%) — acceptable for families but not a draw, mixed tenant base, ~2y average lease.
- Zoned schools: North Fork Elementary School (445 students, 36% FRL); Woodland Middle School (682 students, 49% FRL); Woodland High School (658 students, 42% FRL) — zoned schools at 42% FRL track the district average.
- Watch-outs: flood insurance adds $427/mo.
- Market conditions: 220 active listings in the ZIP; 1 comparable units currently listed for rent nearby; solid renter incomes; 348 units permitted in Cowlitz County in 2024 (40 in 5+ unit buildings).
- Cowlitz County population projected to shrink 8% by 2050 — rents likely to lag national; underwrite the cash flow, not the appreciation.
- At projected returns (-3.0% appreciation + 3.0% rent growth), your $29k cash investment doubles in ~3 years — after that, you're playing with house money.
- Climate carrying-cost: in FEMA flood zone AE (mandatory federal flood insurance) — expect insurance premiums to compound above CPI over the hold.
- Cap rate 22.7% vs local median 2.7% in Woodland — top-decile yield for the area; either an underpriced asset or a hidden risk that comps aren't pricing in. Stress-test before assuming the spread holds.
- This rent runs 34% of the median local income ($94k/yr) — at the standard rent-burdened threshold; future hikes will face affordability resistance.
Questions for listing agent
- It's been on market 48 days. Have you received any prior offers? Is the seller open to a 3% concession, seller financing, or rate buy-down credit?
- What's the actual annual flood-insurance premium (NFIP or private), and is the property in a SFHA with mandatory coverage?
- Is there a deadline driving the sale (1031 exchange, divorce, estate, relocation)? That informs how much negotiation room exists.
- Schools are D-rated, which usually means shorter tenancies and higher turnover. Who's the typical renter profile here, and what's been the actual vacancy rate?
- What's the average days-on-market for RENTAL listings here right now (not sales)? A rising rental-DOM trend means longer vacancies and softer asking-rent achievability than the comps imply.
- What's the recent tenant-quality profile in this submarket — average credit score on applications, eviction rate, late-payment / NSF rate, and stable-employment percentage? A property-management company in the area should have these aggregated.
- How much new for-sale + rental construction is in the pipeline within 1–3 miles? Heavy new supply typically softens prices + rents 12–24 months out; constrained supply supports both.
CashFlowRE · CFR-H073HD22BRJTYK
· Data 1 day ago
cashflowre.app · 2026-05-29