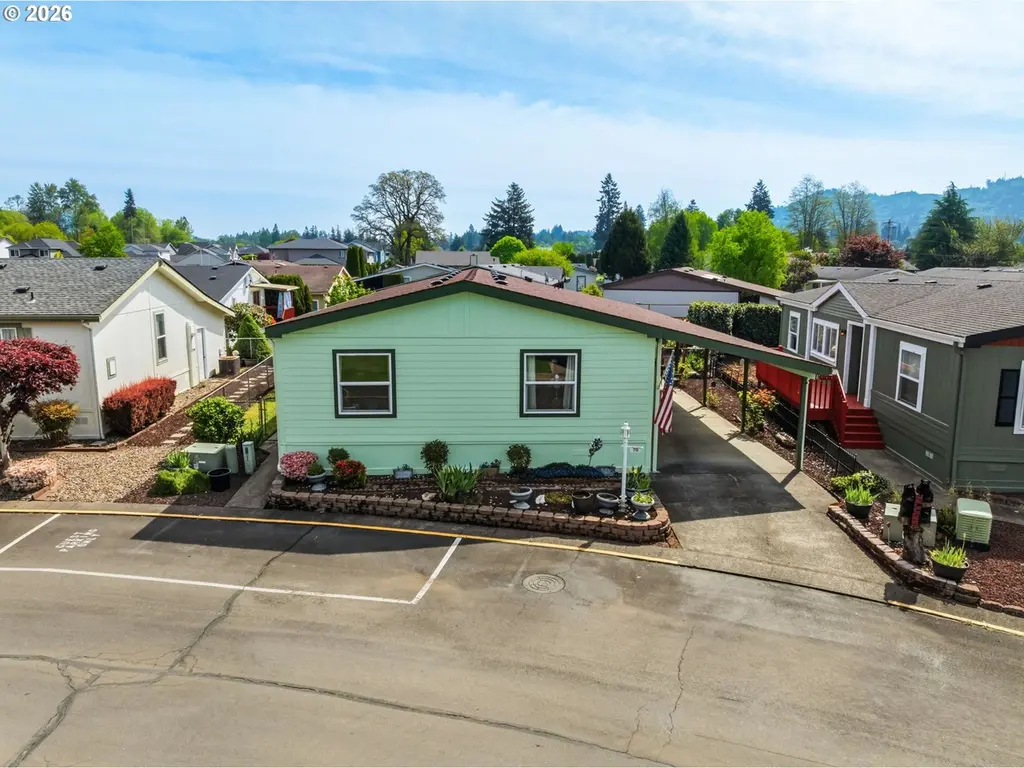
369 Gun Club Rd #79 · Woodland, WA
Flood risk 7/10 · Major
- FEMA flood zone
- AE
- Chance of flooding over 30 yrs
- 0.76%
- Est. flood insurance / yr
- $1,737 – $8,500
Fire risk 4/10 · Minor
- Est. fire insurance / yr
- $604 – $1,122
Heat risk 3/10 · Minor
- Hot days now (above 91°F)
- 8 days/yr
- Hot days in 30 yrs
- 18 days/yr
Wind risk 1/10 · Minimal
- Chance of severe wind over 30 yrs
- —
Air-quality risk 8/10 · Major
- Unhealthy air days now
- 9 days/yr
- Unhealthy air days in 30 yrs
- 11 days/yr
Risk factors via First Street. Map © Google.
Why this score? — see what drove the B+ grade
The composite is a weighted blend of 9 inputs, each scored 0–100. Each bar is that input's sub-score; the figure is the points it added to the 100-point composite (weight × sub-score).
- Cash flow +30.0/30.0
- ARV discount +13.5/15.0
- 1% rule +10.0/10.0
- DSCR +10.0/10.0
- Schools +5.0/10.0
- Livability +3.9/5.0
- Rent growth +2.5/5.0
- Condition / age +2.5/5.0
- Appreciation +0.0/10.0
$105,000
🖨 Deal sheet (PDF) 📄 Offer letter ✓ Due diligence
Key facts
- Gated community
- Private deck
- Fully remodeled
Tags
Property features AI
Finance
- Other: Property located in a manufactured home park
- Financial info: Land lease in effect (monthly lot rent); Land lease expires March 1, 2027
- HOA & community: Senior community; Association provides exterior maintenance, gated access, grounds maintenance, road maintenance, management and meeting/party rooms; Association covers water, sewer, trash and other utilities
Exterior
- Parking: Covered driveway; Attached carport (tandem) with one garage space; Parking available
- Security: Entry security features; Gated community
- Utilities: Public water; Public sewer; Electric service
- Home design: Manufactured home in a park; Residential property, single-level living; Updated/remodeled condition; Territorial view; Gated flag lot with private access
- Construction: Built in 1994; Cement and lap siding exterior; Composition roof; Pillar/post/pier foundation with skirting
- Exterior features: Deck; Fenced yard; Patio; Tool shed and workshop; Yard
Interior
- Kitchen: Dishwasher; Free-standing range; Free-standing refrigerator; Island; Pantry; Range hood; Vaulted ceiling in kitchen
- Bedrooms: Primary bedroom on main level with ensuite, walk-in closet and double closet; Second bedroom on main level with closet; Third bedroom on main level with closet
- Flooring: Luxury vinyl plank / vinyl flooring throughout
- Bathrooms: Two full bathrooms on the main level; Primary bathroom updated/remodeled with double sinks and walk-in shower; Second bathroom with bathtub/shower
- Heating & cooling: Forced air heating; Window cooling unit(s); Electric water heater
- Interior features: One-level living with accessibility features; Walk-in shower in primary bathroom; Garage door opener; High-speed internet; Luxury vinyl plank / vinyl flooring throughout; Vaulted ceilings; Washer and dryer (in unit); Double-pane windows with vinyl frames; Crawl space basement with exterior entry
- Laundry & utility: Dedicated laundry room on main level with washer and dryer hookups
Neighborhood map
What this means for you Summary
Snapshot
- This is a 3-bed/2.0-bath manufactured listed at $105k.
Deal economics
- At list price, monthly cash flow is $1k ($12k/yr) — positive.
- The deal already cash-flows at list — no discount required.
- Meets the 1% rule at list price ($3k rent vs $105k).
- Recommended offer: $102k (3.0% below list) — sets the bar for market timing.
- Cap rate 22.7% vs local median 2.7% in Woodland — top-decile yield for the area; either an underpriced asset or a hidden risk that comps aren't pricing in. Stress-test before assuming the spread holds.
Location & tenants
- Location reads 77/100 on livability (#152 in WA, #3,252 nationally) — a middle-class / working-renter tenant base. Strengths: housing A+, health & safety A+, amenities B+; Watch: commute F.
- Woodland School District (town): math 48% / reading 62% proficiency, ranked #94 of 291 in WA (top 32%) — acceptable for families but not a draw, mixed tenant base, ~2y average lease.
- Zoned schools: North Fork Elementary School (445 students, 36% FRL); Woodland Middle School (682 students, 49% FRL); Woodland High School (658 students, 42% FRL) — zoned schools at 42% FRL track the district average.
- Market conditions: 220 active listings in the ZIP; 1 comparable units currently listed for rent nearby; solid renter incomes; 348 units permitted in Cowlitz County in 2024 (40 in 5+ unit buildings).
- This rent runs 34% of the median local income ($94k/yr) — at the standard rent-burdened threshold; future hikes will face affordability resistance.
Forward outlook
- Local home prices are declining (-3.0%/yr); year-one equity from $726 of loan paydown is wiped out by about $3k of value loss. Plan a longer hold.
- Cowlitz County population projected to shrink 8% by 2050 — rents likely to lag national; underwrite the cash flow, not the appreciation.
- At projected returns (-3.0% appreciation + 3.0% rent growth), your $29k cash investment doubles in ~3 years — after that, you're playing with house money.
Negotiation context
- It's been on market 48 days — a 3% lower offer ($102k) is reasonable based on typical stale-listing flexibility.
Risks & watch-outs
- Watch-outs: flood insurance adds $427/mo.
- Climate carrying-cost: in FEMA flood zone AE (mandatory federal flood insurance) — expect insurance premiums to compound above CPI over the hold.
Questions for the listing agent
- It's been on market 48 days. Have you received any prior offers? Is the seller open to a 3% concession, seller financing, or rate buy-down credit?
- What's the actual annual flood-insurance premium (NFIP or private), and is the property in a SFHA with mandatory coverage?
- Is there a deadline driving the sale (1031 exchange, divorce, estate, relocation)? That informs how much negotiation room exists.
- Schools are D-rated, which usually means shorter tenancies and higher turnover. Who's the typical renter profile here, and what's been the actual vacancy rate?
- What's the average days-on-market for RENTAL listings here right now (not sales)? A rising rental-DOM trend means longer vacancies and softer asking-rent achievability than the comps imply.
- What's the recent tenant-quality profile in this submarket — average credit score on applications, eviction rate, late-payment / NSF rate, and stable-employment percentage? A property-management company in the area should have these aggregated.
- How much new for-sale + rental construction is in the pipeline within 1–3 miles? Heavy new supply typically softens prices + rents 12–24 months out; constrained supply supports both.
Investment metrics
- 1% rule
- 2.54% ✓
- Cap rate
- 22.74%
- Cash-on-cash
- 58.74%
- DSCR
- 3.61
- GRM
- 3.3
CMA / ARV
- ARV (median comp)
- $121,000
- List price
- $105,000
- Delta
- -13.22%
- Verdict
- UNDERPRICED
- Comps
- 15 within 1.0 mi
Show comp detail 7 sales within ~0.75 mi
| Address | Dist | Beds/Ba | Sqft | Sold | Price | $/sf | Match |
|---|---|---|---|---|---|---|---|
| 369 Gun Club Rd #101 | 0.06mi | 3/2.0 | 1,782 (0%) | 1mo | $95,000 | $53 | 96 |
| 369 GUN CLUB Rd #48 | 0.04mi | 3/2.0 | 1,782 (0%) | 8mo | $90,000 | $51 | 92 |
| 369 Gun Club Rd #117 | 0.03mi | 3/2.0 | 1,809 (+2%) | 6mo | $149,000 | $82 | 91 |
| 369 Gun Club Rd #53 | 0.09mi | 3/2.0 | 1,726 (-3%) | 3mo | $125,000 | $72 | 88 |
| 603 Insel Rd | 0.17mi | 2/2.0 (-1) | 1,620 (-9%) | 3mo | $325,000 | $201 | 69 |
| 205 Forest Park Rd | 0.42mi | 3/2.0 | 1,944 (+9%) | 16mo | $520,000 | $267 | 52 |
| 1804 Springwood St | 0.63mi | 4/2.0 (+1) | 1,984 (+11%) | 11mo | $460,000 | $232 | 37 |
Match score weights: distance 35% · size 25% · config 20% · recency 20%. Top-matched comps best support the ARV.
Projected returns pro-forma
-3.0% appreciation · 3.0% rent growth · sell at horizon
- IRR
- 38.0%
- Equity multiple
- 2.62×
- Total profit
- $47,751
- Equity at exit
- $15,656
- IRR
- 44.6%
- Equity multiple
- 5.28×
- Total profit
- $125,720
- Equity at exit
- $9,078
Cash invested: $29,400 (down + closing). Projections, not guarantees.
Landlord ↔ Tenant lean methodology
- Overall (STATE)
- 28 Tenant-Leaning
- State Washington
- 28 Tenant-Leaning · D+8
- County
- — inherits STATE
- City
- — inherits STATE
ZIP-level market 98674
- Home prices YoY
- -21.8%
- Active inventory
- 220
- Price-to-rent
- 3.3×
Monthly cashflow live
- Estimated rent
- $2,670 medium interval (Pro) →
- Mortgage (P&I)
- −$551
- Tax from tax record
- −$75 /mo · $905/yr
- Insurance
- −$44
- Flood insurance flood zone
- −$427 /mo · $5,118/yr
- HOA
- −$0
- Vacancy / Maint / Mgmt
- −$561
- Net cashflow
- $1,013
Break-even live
Sensitivity live
| Price | -10% $1,072 | -5% $1,042 | +0% $1,013 | +5% $983 | +10% $953 |
|---|---|---|---|---|---|
| Rent | -10% $802 | -5% $907 | +0% $1,013 | +5% $1,118 | +10% $1,224 |
| Rate | -1.0pp $1,066 | -0.5pp $1,039 | base $1,013 | +0.5pp $985 | +1.0pp $958 |
UW: 25.0% down · 7.5% · 30yr · 1.5% tax · 5.0% vac · 8.0% maint · 8.0% mgmt
Financing live
Cash to close
- Down payment
- $26,250
- Closing costs
- $3,150
- Reserves months
- —
- Total cash needed
- —
Loan-product check · same deal, 3 products live
Conventional
25% down · 7.5% · 30yr
- Down + closing
- —
- Monthly P&I
- —
- Monthly cashflow
- —
- DSCR
- —
- Eligible?
- —
Personal DTI + credit; lowest rate.
DSCR
20% down · 8.5% · 30yr
- Down + closing
- —
- Monthly P&I
- —
- Monthly cashflow
- —
- DSCR
- —
- Eligible?
- —
No personal income docs; deal must DSCR.
Hard money
10% down · 12.0% · 12mo
- Down + closing
- —
- Monthly P&I
- —
- Monthly cashflow
- —
- DSCR
- —
- Eligible?
- —
Short-term bridge; refi at stabilization.
Rent comps 1 comps
| Address | Beds | Baths | Sqft | Rent | $/sqft | DOM | Units | Dist |
|---|---|---|---|---|---|---|---|---|
| 332 York St Unit 2 Woodland, WA | 3.0 | 2.0 | 1497 | $2,529 | $1.69 | 44d | 1 | 0.26mi |
Listing history 19 events
-
2026-06-19days on market $105,000 Active 48 DOM
-
2026-06-18days on market $105,000 Active 47 DOM
-
2026-06-17days on market $105,000 Active 46 DOM
-
2026-06-16days on market $105,000 Active 45 DOM
-
2026-06-15days on market $105,000 Active 44 DOM
-
2026-06-14pricedays on market $105,000 Active 42 DOM
-
2026-06-13pricedays on market $115,000 Active 41 DOM
-
2026-06-10days on market $120,000 Active 39 DOM
-
2026-06-09days on market $120,000 Active 38 DOM
-
2026-06-08days on market $120,000 Active 37 DOM
-
2026-06-07days on market $120,000 Active 36 DOM
-
2026-06-05days on market $120,000 Active 33 DOM
-
2026-06-03days on market $120,000 Active 32 DOM
-
2026-06-02days on market $120,000 Active 31 DOM
-
2026-06-01days on market $120,000 Active 30 DOM
-
2026-05-31days on market $120,000 Active 29 DOM
-
2026-05-30days on market $120,000 Active 28 DOM
-
2026-05-17price $120,000 678-char remark
-
2026-05-02$135,000 Active 678-char remark
ⓘ Source: listings_history table (triggers on properties + properties_extension) + one-shot
backfill from property_details.listing_events for pre-trigger history.
Tax reassessment forecast WA · Resets to sale price
- Current annual tax
- $905 · $75/mo
- Projected year-2 tax
- $1,029 · $86/mo
- Expected delta
- +$124/yr (+$10/mo · 13.7%)
ⓘ Screening estimate from a state-policy table — verify with the county assessor before closing.
Climate risk First Street
- Flood 7/10 Severe FEMA zone AE · 76% chance over 30 yrs
- Wildfire 4/10 Moderate
- Heat 3/10 Moderate 8 d/yr ≥91°F today · 18 d/yr by 30 yrs out
- Wind 1/10 Low
- Air quality 8/10 Severe 9 unhealthy d/yr today · 11 by 30 yrs out
Nearby sold comps map
Loading sold comps map…
Walkable amenities ~0.75 mi
Loading nearby amenities…
Taxation est. · year 1
- Rental income
- $32,036
- − Mortgage interest
- −$5,882
- − Property taxes
- −$905
- − Insurance
- −$5,644
- − Repairs & maintenance
- −$2,563
- − Management
- −$2,563
- − Depreciation
- −$3,055
- Taxable income
- $11,425
- Est. tax owed @ 24.0%
- −$2,742
- After-tax cash flow
- $9,410/yr
For passive investors: Depreciation is non-cash, so a rental often shows a tax loss while cash-flowing — sheltering income. Rental losses are passive: they offset passive income freely, and up to $25,000/yr can offset ordinary (W-2) income if you actively participate and your MAGI is under $100k (phasing out to $0 by $150k); unused losses carry forward. On sale, claimed depreciation is recaptured at up to 25%, and gains may owe capital-gains tax (a 1031 exchange can defer both). Figures are a year-1 estimate at your 24.0% rate — not tax advice; consult a CPA.
Schools (NCES district)
- District
- Woodland School District
- NCES district ID
- 5310050
- Math proficiency
- 48% ▲ 4.00%
- Reading proficiency
- 62% ▲ 4.00%
- Median HH income
- $60,973
- Composite
- 49.77/100
- National rank
- #4219
- State rank
- #94 of 291 in WA
Livability — Woodland
- Score
- 77/100
- State rank
- #152
- US rank
- #3252
Category grades
Schools grade is shown separately in the Schools card above.
Census & demographics
- Census place
- Woodland, WA
- County
- Clark County · 513,189 people
- City population
- 17,525
- Metro
- Longview, WA
- Population (ZIP)
- 17,525
- Household income
- $94,245
- Rent vs Own
- Severe rent burden
- 209.0
Population outlook (Cowlitz County) Hauer SSP2
- Today (2025)
- 104,780 people
- By 2030
- 103,980 · -0.8%
- By 2040
- 100,769 · -3.8%
- By 2050
- 96,685 · -7.7%
- By 2075
- 86,454 · -17.5%
- By 2100
- 74,052 · -29.3%
Race, ethnicity, and origin ACS 2023
- Neighborhood character
- Predominantly White (79%)
- Race & ethnicity
- White 79% Hispanic / Latino 14% Two or more races 9% Black 1% Asian 1%
- Hispanic origin (detail)
- Mexican 10%
- Common ancestry
- Portuguese 4% Italian 3% Lithuanian 2%
- Foreign-born
- 7% · Canada, Jamaica
- Languages at home
- 86% English-only · Spanish 9% German/W. Germanic 2% French/Haitian/Cajun 1%
Political lean MEDSL · Cowlitz
- 2024 margin
- R (+19.9) · D 38.7% · R 58.6% · Other 2.7%
- 2008→2024 swing
- -31.1pp toward R · 2008: 11.2pp · 2024: -19.9pp
- All cycles
- 2024: R+19.9 2020: R+17.4 2016: R+13.7 2012: D+4.4 2008: D+11.2
Not yet ingested
- Civics
- —
Market trends
- HPI YoY
- ▼ -92.68%
- Current HPI
- 333.4106
- Rent YoY
- —
- Metro
- Longview, WA
- State GDP YoY
- ▲ 4.65%
- F500 in state
- 22
Industry mix (Fortune 500 HQ in WA)
| Industry | F500 HQs | Revenue |
|---|---|---|
| Retail | 2 | $269B |
|
||
| Technology / Retail | 1 | $638B |
|
||
| Technology | 1 | $245B |
|
||
| Telecommunications | 1 | $38B |
|
||
| Food / Beverage | 1 | $36B |
|
||
| Automotive / Trucks | 1 | $34B |
|
||
Price history
-22.2% since first listed4 events — show timeline
- 2026-06-13 Price Changed $105,000 RMLS
- 2026-06-10 Price Changed $115,000 RMLS
- 2026-05-17 Price Changed $120,000 RMLS
- 2026-05-02 Listed $135,000 RMLS
Property tax history
+2.6%/yrLatest (2026): $905 · -5.5% YoY. Source: county tax records.
Cash-flow waterfall
monthlySold comps — $/sqft
last 12 mo · ≤1 miLoading sold comps…