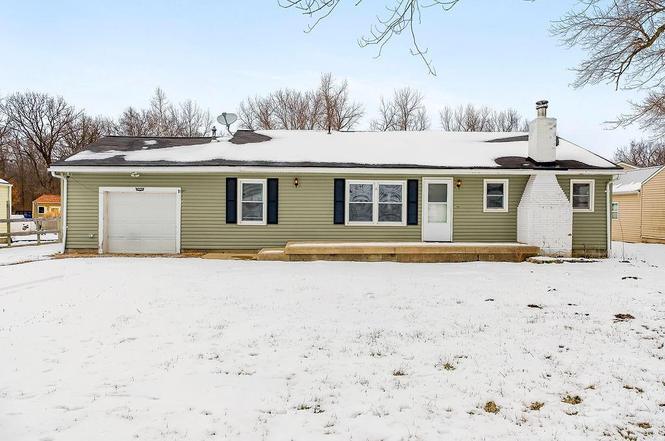
13004 E 99th St
Kansas City, MO 64138
$179,900D
2 bd · 1.0 ba ·
1,420 sqft ·
Built 1955
· SingleFamily
· Pending
· 90 DOM
Cashflow @ list (25.0% down · 7.5%)
Estimated rent
$1,502/mo
Mortgage (P&I)
−$943
Tax + insurance
−$254
HOA
−$0
Vac / Maint / Mgmt
−$316
Net cashflow
$-10/mo
Annual
$-123/yr
Cap rate
6.22%
Cash-on-cash
-0.24%
DSCR
0.99
1% rule
0.84%
Cash to close
$50,372
Investor read
- This is a 2-bed/1.0-bath single-family listed at $180k.
- At list price, monthly cash flow is $-10 ($-123/yr) — negative.
- To cash-flow at today's rent, offer at most $178k (1.0% below list).
- To meet the 1% rule (rent ≥ 1% of price), the offer needs to be $150k (16.5% below list).
- It's been on market 90 days — a 6% lower offer ($169k) is reasonable based on typical stale-listing flexibility.
- Recommended offer: $150k (16.5% below list) — sets the bar for 1% rule.
- Local home prices are declining (-3.0%/yr); year-one equity from $1k of loan paydown is wiped out by about $5k of value loss. Plan a longer hold.
- Location reads 78/100 on livability (#28 in MO, #2,671 nationally) — a middle-class / working-renter tenant base. Strengths: amenities A+, commute A+, cost of living A+; Watch: crime F.
- Lee'S Summit R-VII (suburban): math 46% / reading 55% proficiency, ranked #23 of 324 in MO (top 7%) — acceptable for families but not a draw, mixed tenant base, ~2y average lease; only 16% free/reduced lunch — higher-income household profile.
- Zoned schools: Hazel Grove Elem. (math 39% / reading 51%, grade D-, #410 of 1,115 statewide, top 37%, 341 students, 20% FRL); Bernard C. Campbell Middle (math 41% / reading 47%, grade D, #121 of 391 statewide, top 32%, 1,067 students, 27% FRL); Lee'S Summit North High (math 41% / reading 69%, grade C, #65 of 521 statewide, top 13%, 2,007 students, 22% FRL).
- Watch-outs: built in 1955 — expect roof / HVAC / electrical / plumbing capex.
- Market conditions: Rents rising (+3.1%/yr); 140 active listings in the ZIP; 1 comparable units currently listed for rent nearby; 4,002 units permitted in Jackson County in 2024 (2,271 in 5+ unit buildings).
- Jackson County population projected at +4% by 2050 — modest demand growth; plan on rents tracking national, not racing it.
- 4 sale attempts with the ask held roughly flat each time — persistent listings suggest the price (not the market) is what's stuck; bring a comps-based counter.
- Climate carrying-cost: moderate flood risk — expect insurance premiums to compound above CPI over the hold.
- Cap rate 6.2% vs local median 3.9% in Kansas City — top-decile yield for the area; either an underpriced asset or a hidden risk that comps aren't pricing in. Stress-test before assuming the spread holds.
- This rent runs 31% of the median local income ($59k/yr) — at the standard rent-burdened threshold; future hikes will face affordability resistance.
Questions for listing agent
- What do current leases actually rent for vs. the listed asking? Can we see a recent rent roll and the last 12 months of T-12 income?
- It's been on market 90 days. Have you received any prior offers? Is the seller open to a 16% concession, seller financing, or rate buy-down credit?
- Built in 1955 — when were the roof, HVAC, electrical panel, plumbing, and water heater last replaced?
- Why hasn't it sold? Are there any deal-killer items the seller is aware of (foundation, flood, title, zoning, code violations)?
- Is there a deadline driving the sale (1031 exchange, divorce, estate, relocation)? That informs how much negotiation room exists.
- Crime grade is F in this area — have there been break-ins, vandalism, or insurance claims at this property in the last 3 years? What carrier currently insures it and at what premium?
- The area grade is low — what's the realistic commute time and amenity access for the typical tenant pool here? Any planned neighborhood developments (good or bad) we should know about?
- What's the average days-on-market for RENTAL listings here right now (not sales)? A rising rental-DOM trend means longer vacancies and softer asking-rent achievability than the comps imply.
CashFlowRE · CFR-H0MQ302P76CEY2
· Data 4 weeks ago
cashflowre.app · 2026-05-29