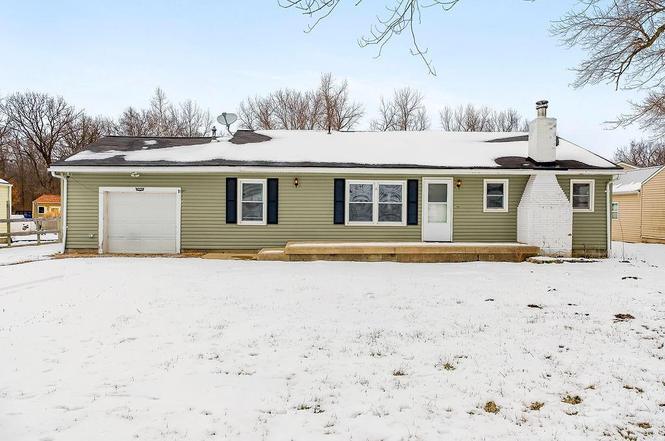
13004 E 99th St · Kansas City, MO
Flood risk 5/10 · Moderate
- FEMA flood zone
- X (unshaded)
- Chance of flooding over 30 yrs
- 0.24%
- Est. flood insurance / yr
- $507 – $1,088
Fire risk 1/10 · Minimal
- Est. fire insurance / yr
- $1,054 – $1,958
Heat risk 4/10 · Minor
- Hot days now (above 106°F)
- 7 days/yr
- Hot days in 30 yrs
- 17 days/yr
Wind risk 2/10 · Minimal
- Chance of severe wind over 30 yrs
- —
Air-quality risk 3/10 · Minor
- Unhealthy air days now
- 4 days/yr
- Unhealthy air days in 30 yrs
- 4 days/yr
Risk factors via First Street. Map © Google.
Why this score? — see what drove the D grade
The composite is a weighted blend of 9 inputs, each scored 0–100. Each bar is that input's sub-score; the figure is the points it added to the 100-point composite (weight × sub-score).
- Cash flow +13.0/30.0
- ARV discount +7.5/15.0
- Schools +4.6/10.0
- DSCR +3.9/10.0
- Livability +3.9/5.0
- 1% rule +3.4/10.0
- Rent growth +3.3/5.0
- Condition / age +2.5/5.0
- Appreciation +0.0/10.0
$179,900
🖨 Deal sheet (PDF) 📄 Offer letter ✓ Due diligence
Listing remarks
Tucked away in one of Kansas City’s most sought-after school districts, this move-in ready home offers a great blend of space, privacy, and potential. With a partially wooded backdrop and large neighboring lots, the setting feels more like a peaceful retreat than a typical suburban property. Inside, you’ll find generously sized rooms, warm wood accents, and a cozy fireplace that anchors the main living space—perfect for relaxing evenings at home. The layout offers flexibility for easy updates, additions, or reimagining the space to match your vision. Step outside to a spacious backyard with deck access, ideal for entertaining, gardening, or simply enjoying the wide-open fe
Key facts
- 0.56 acre lot
- Garage
- Listed 90 days
Property features AI
Finance
- Financial info: Annual tax amount reported
Exterior
- Parking: Attached garage (1 car)
- Utilities: Public water; Septic tank
- Home design: Single-family residence; Ranch floor plan; Attached property
- Construction: Vinyl siding; Composition roof; Crawl space foundation; Approximately 51–75 years old
- Exterior features: Not in a flood plain; Lot approximately 24,446 square feet
Interior
- Bedrooms: 2 bedrooms
- Flooring: Carpet; Luxury vinyl
- Bathrooms: 1 full bathroom
- Heating & cooling: Propane heating; Electric cooling
- Interior features: Formal dining area; Office; Living room fireplace
- Laundry & utility: Laundry area located in the garage
Neighborhood map
What this means for you Summary
Snapshot
- This is a 2-bed/1.0-bath single-family listed at $180k.
Deal economics
- At list price, monthly cash flow is $-10 ($-123/yr) — negative.
- To cash-flow at today's rent, offer at most $178k (1.0% below list).
- To meet the 1% rule (rent ≥ 1% of price), the offer needs to be $150k (16.5% below list).
- Recommended offer: $150k (16.5% below list) — sets the bar for 1% rule.
- Cap rate 6.2% vs local median 3.9% in Kansas City — top-decile yield for the area; either an underpriced asset or a hidden risk that comps aren't pricing in. Stress-test before assuming the spread holds.
Location & tenants
- Location reads 78/100 on livability (#28 in MO, #2,671 nationally) — a middle-class / working-renter tenant base. Strengths: amenities A+, commute A+, cost of living A+; Watch: crime F.
- Lee'S Summit R-VII (suburban): math 46% / reading 55% proficiency, ranked #23 of 324 in MO (top 7%) — acceptable for families but not a draw, mixed tenant base, ~2y average lease; only 16% free/reduced lunch — higher-income household profile.
- Zoned schools: Hazel Grove Elem. (math 39% / reading 51%, grade D-, #410 of 1,115 statewide, top 37%, 341 students, 20% FRL); Bernard C. Campbell Middle (math 41% / reading 47%, grade D, #121 of 391 statewide, top 32%, 1,067 students, 27% FRL); Lee'S Summit North High (math 41% / reading 69%, grade C, #65 of 521 statewide, top 13%, 2,007 students, 22% FRL).
- Market conditions: Rents rising (+3.1%/yr); 140 active listings in the ZIP; 1 comparable units currently listed for rent nearby; 4,002 units permitted in Jackson County in 2024 (2,271 in 5+ unit buildings).
- This rent runs 31% of the median local income ($59k/yr) — at the standard rent-burdened threshold; future hikes will face affordability resistance.
Forward outlook
- Local home prices are declining (-3.0%/yr); year-one equity from $1k of loan paydown is wiped out by about $5k of value loss. Plan a longer hold.
- Jackson County population projected at +4% by 2050 — modest demand growth; plan on rents tracking national, not racing it.
Negotiation context
- It's been on market 90 days — a 6% lower offer ($169k) is reasonable based on typical stale-listing flexibility.
- 4 sale attempts with the ask held roughly flat each time — persistent listings suggest the price (not the market) is what's stuck; bring a comps-based counter.
Risks & watch-outs
- Watch-outs: built in 1955 — expect roof / HVAC / electrical / plumbing capex.
- Climate carrying-cost: moderate flood risk — expect insurance premiums to compound above CPI over the hold.
Questions for the listing agent
- What do current leases actually rent for vs. the listed asking? Can we see a recent rent roll and the last 12 months of T-12 income?
- It's been on market 90 days. Have you received any prior offers? Is the seller open to a 16% concession, seller financing, or rate buy-down credit?
- Built in 1955 — when were the roof, HVAC, electrical panel, plumbing, and water heater last replaced?
- Why hasn't it sold? Are there any deal-killer items the seller is aware of (foundation, flood, title, zoning, code violations)?
- Is there a deadline driving the sale (1031 exchange, divorce, estate, relocation)? That informs how much negotiation room exists.
- Crime grade is F in this area — have there been break-ins, vandalism, or insurance claims at this property in the last 3 years? What carrier currently insures it and at what premium?
- The area grade is low — what's the realistic commute time and amenity access for the typical tenant pool here? Any planned neighborhood developments (good or bad) we should know about?
- What's the average days-on-market for RENTAL listings here right now (not sales)? A rising rental-DOM trend means longer vacancies and softer asking-rent achievability than the comps imply.
- What's the recent tenant-quality profile in this submarket — average credit score on applications, eviction rate, late-payment / NSF rate, and stable-employment percentage? A property-management company in the area should have these aggregated.
- How much new for-sale + rental construction is in the pipeline within 1–3 miles? Heavy new supply typically softens prices + rents 12–24 months out; constrained supply supports both.
Investment metrics
- 1% rule
- 0.84% ✗
- Cap rate
- 6.22%
- Cash-on-cash
- -0.24%
- DSCR
- 0.99
- GRM
- 10.0
CMA / ARV
No comps found within radius.
Projected returns pro-forma
-3.0% appreciation · 3.07% rent growth · sell at horizon
- IRR
- -16.6%
- Equity multiple
- 0.41×
- Total profit
- $-29,706
- Equity at exit
- $26,824
- IRR
- -8.3%
- Equity multiple
- 0.48×
- Total profit
- $-26,298
- Equity at exit
- $15,554
Cash invested: $50,372 (down + closing). Projections, not guarantees.
Landlord ↔ Tenant lean methodology
- Overall (STATE)
- 81 Strongly Landlord-Friendly
- State Missouri
- 81 Strongly Landlord-Friendly · R+10
- County
- — inherits STATE
- City
- — inherits STATE
ZIP-level market 64138
- Rents YoY
- 3.1%
- Active inventory
- 140
- Price-to-rent
- 10.0×
Monthly cashflow live
- Estimated rent
- $1,502 medium interval (Pro) →
- Mortgage (P&I)
- −$943
- Tax from tax record
- −$179 /mo · $2,146/yr
- Insurance
- −$75
- HOA
- −$0
- Vacancy / Maint / Mgmt
- −$316
- Net cashflow
- $-10
Break-even live
Sensitivity live
| Price | -10% $92 | -5% $41 | +0% $-10 | +5% $-61 | +10% $-112 |
|---|---|---|---|---|---|
| Rent | -10% $-129 | -5% $-70 | +0% $-10 | +5% $49 | +10% $108 |
| Rate | -1.0pp $80 | -0.5pp $35 | base $-10 | +0.5pp $-57 | +1.0pp $-104 |
UW: 25.0% down · 7.5% · 30yr · 1.5% tax · 5.0% vac · 8.0% maint · 8.0% mgmt
Financing live
Cash to close
- Down payment
- $44,975
- Closing costs
- $5,397
- Reserves months
- —
- Total cash needed
- —
Loan-product check · same deal, 3 products live
Conventional
25% down · 7.5% · 30yr
- Down + closing
- —
- Monthly P&I
- —
- Monthly cashflow
- —
- DSCR
- —
- Eligible?
- —
Personal DTI + credit; lowest rate.
DSCR
20% down · 8.5% · 30yr
- Down + closing
- —
- Monthly P&I
- —
- Monthly cashflow
- —
- DSCR
- —
- Eligible?
- —
No personal income docs; deal must DSCR.
Hard money
10% down · 12.0% · 12mo
- Down + closing
- —
- Monthly P&I
- —
- Monthly cashflow
- —
- DSCR
- —
- Eligible?
- —
Short-term bridge; refi at stabilization.
Rent comps 1 comps
| Address | Beds | Baths | Sqft | Rent | $/sqft | DOM | Units | Dist |
|---|---|---|---|---|---|---|---|---|
| 14500 E Bannister Rd Kansas City, MO | 1.0–3.0 | 1.0–2.5 | 1072 | $1,666 | $1.55 | 3d | 13 | 0.97mi |
Listing history 14 events
-
2026-05-06status Pending
-
2026-05-05status Active
-
2026-04-20historical Active Under Contract
-
2026-03-25price $179,900
-
2026-02-20price $186,000
-
2026-02-06$189,000 Active
-
2026-01-20historical $189,000
-
2025-11-04historical
-
2025-08-08$200,000 Active
-
2025-07-25historical
-
2025-05-09price $199,000
-
2025-03-24$220,000 Active
-
2023-04-28soldstatus
-
1986-08-01soldstatus
ⓘ Source: listings_history table (triggers on properties + properties_extension) + one-shot
backfill from property_details.listing_events for pre-trigger history.
Tax reassessment forecast MO · Resets to sale price
- Current annual tax
- $2,146 · $179/mo
- Projected year-2 tax
- $2,146 · $179/mo
- Expected delta
- $0/yr ($0/mo · 0.0%)
ⓘ Screening estimate from a state-policy table — verify with the county assessor before closing.
Climate risk First Street
- Flood 5/10 Major FEMA zone X (unshaded) · 24% chance over 30 yrs
- Wildfire 1/10 Low
- Heat 4/10 Moderate 7 d/yr ≥106°F today · 17 d/yr by 30 yrs out
- Wind 2/10 Low
- Air quality 3/10 Moderate 4 unhealthy d/yr today · 4 by 30 yrs out
Nearby sold comps map
Loading sold comps map…
Walkable amenities ~0.75 mi
Loading nearby amenities…
Taxation est. · year 1
- Rental income
- $18,029
- − Mortgage interest
- −$10,077
- − Property taxes
- −$2,146
- − Insurance
- −$900
- − Repairs & maintenance
- −$1,442
- − Management
- −$1,442
- − Depreciation
- −$5,233
- Taxable loss
- −$3,212
- Est. tax savings @ 24.0%
- +$771
- After-tax cash flow
- $647/yr
For passive investors: Depreciation is non-cash, so a rental often shows a tax loss while cash-flowing — sheltering income. Rental losses are passive: they offset passive income freely, and up to $25,000/yr can offset ordinary (W-2) income if you actively participate and your MAGI is under $100k (phasing out to $0 by $150k); unused losses carry forward. On sale, claimed depreciation is recaptured at up to 25%, and gains may owe capital-gains tax (a 1031 exchange can defer both). Figures are a year-1 estimate at your 24.0% rate — not tax advice; consult a CPA.
Schools (NCES district)
- District
- Lee'S Summit R-VII
- NCES district ID
- 2918300
- Math proficiency
- 46% ▼ -12.00%
- Reading proficiency
- 55% ▼ -6.00%
- Median HH income
- $77,031
- Composite
- 45.75/100
- National rank
- #2570
- State rank
- #23 of 324 in MO
Livability — Kansas City
- Score
- 78/100
- State rank
- #28
- US rank
- #2671
Category grades
Schools grade is shown separately in the Schools card above.
Census & demographics
- Census place
- Kansas City, MO
- County
- Jackson County · 687,798 people
- City population
- 439,467
- Metro
- Kansas City, MO-KS
- Population (ZIP)
- 23,805
- Household income
- $58,638
- Rent vs Own
- Severe rent burden
- 810.0
Population outlook (Jackson County) Hauer SSP2
- Today (2025)
- 719,589 people
- By 2030
- 731,456 · +1.6%
- By 2040
- 746,689 · +3.8%
- By 2050
- 749,289 · +4.1%
- By 2075
- 736,227 · +2.3%
- By 2100
- 668,210 · -7.1%
Race, ethnicity, and origin ACS 2023
- Neighborhood character
- Diverse neighborhood (Simpson 0.61)
- Race & ethnicity
- Black 46% White 42% Two or more races 6% Hispanic / Latino 5% Asian 2%
- Common ancestry
- Slovak 2% Ukrainian 1% Italian 1%
- Foreign-born
- 6% · Canada, China
- Languages at home
- 91% English-only · Spanish 4% Arabic 3% Other Indo-European 1%
Political lean MEDSL · Jackson
- 2024 margin
- D (+19.3) · D 58.9% · R 39.5% · Other 1.6%
- 2008→2024 swing
- -6.1pp toward R · 2008: 25.4pp · 2024: 19.3pp
- All cycles
- 2024: D+19.3 2020: D+22.0 2016: D+16.6 2012: D+19.0 2008: D+25.4
Not yet ingested
- Civics
- —
Market trends
- HPI YoY
- ▼ -186.34%
- Current HPI
- 274.681
- Rent YoY
- ▲ 3.07%
- Metro
- Kansas City, MO-KS
- State GDP YoY
- ▲ 1.84%
- F500 in state
- 20
Industry mix (Fortune 500 HQ in MO)
| Industry | F500 HQs | Revenue |
|---|---|---|
| Healthcare | 1 | $163B |
|
||
| Insurance | 1 | $21B |
|
||
| Industrial Technology | 1 | $17B |
|
||
| Retail | 1 | $16B |
|
||
| Industrial Distribution | 1 | $10B |
|
||
| Utilities | 1 | $9B |
|
||
Price history
-18.2% since first listed14 events — show timeline
- 2026-05-06 Pending — Heartland MLS as Distributed by MLS Grid
- 2026-05-05 Relisted — Heartland MLS as Distributed by MLS Grid
- 2026-04-20 Contingent — Heartland MLS as Distributed by MLS Grid
- 2026-03-25 Price Changed $179,900 Heartland MLS as Distributed by MLS Grid
- 2026-02-20 Price Changed $186,000 Heartland MLS as Distributed by MLS Grid
- 2026-02-06 Listed $189,000 Heartland MLS as Distributed by MLS Grid
- 2026-01-20 Coming Soon $189,000 Heartland MLS as Distributed by MLS Grid
- 2025-11-04 Listing Removed — Heartland MLS as Distributed by MLS Grid
- 2025-08-08 Listed $200,000 Heartland MLS as Distributed by MLS Grid
- 2025-07-25 Listing Removed — Heartland MLS as Distributed by MLS Grid
- 2025-05-09 Price Changed $199,000 Heartland MLS as Distributed by MLS Grid
- 2025-03-24 Listed $220,000 Heartland MLS as Distributed by MLS Grid
- 2023-04-28 Sold (Public Records) — Public Records
- 1986-08-01 Sold (Public Records) — Public Records
Property tax history
+3.6%/yrLatest (2025): $2,146 · -25.7% YoY. Source: county tax records.
Cash-flow waterfall
monthlySold comps — $/sqft
last 12 mo · ≤1 miLoading sold comps…