207 N 1st St
Marble Hill, MO 63764
$134,900D
3 bd · 2.0 ba ·
1,406 sqft ·
Built 1962
· SingleFamily
· Active
· 43 DOM
Cashflow @ list (25.0% down · 7.5%)
Estimated rent
$1,194/mo
Mortgage (P&I)
−$707
Tax + insurance
−$225
HOA
−$0
Vac / Maint / Mgmt
−$251
Net cashflow
$11/mo
Annual
$129/yr
Cap rate
6.39%
Cash-on-cash
0.34%
DSCR
1.02
1% rule
0.88%
Cash to close
$37,772
Investor read
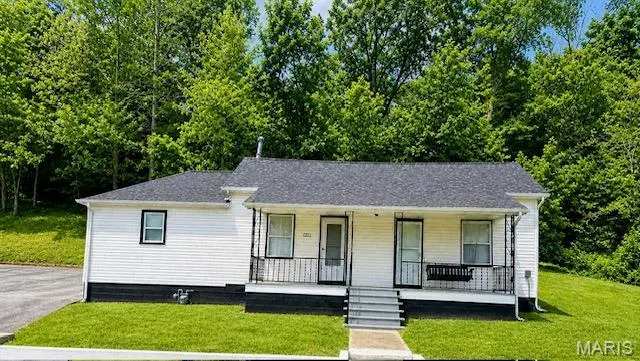
- This is a 3-bed/2.0-bath single-family listed at $135k. Condition is rated fair.
- At list price, monthly cash flow is $11 ($129/yr) — positive.
- The deal already cash-flows at list — no discount required.
- To meet the 1% rule (rent ≥ 1% of price), the offer needs to be $119k (11.5% below list).
- It's been on market 43 days — a 3% lower offer ($131k) is reasonable based on typical stale-listing flexibility.
- Recommended offer: $119k (11.5% below list) — sets the bar for 1% rule.
- In year one you build about $5k of equity ($933 loan paydown + $4k appreciation (3.0% local appreciation)).
- Location reads 60/100 on livability (#508 in MO) — a middle-class / working-renter tenant base. Strengths: cost of living A+, crime A, housing A-; Watch: amenities F, commute F, employment F.
- Woodland R-IV (rural): math 27% / reading 42% proficiency, ranked #239 of 324 in MO (top 74%) — families likely to look elsewhere, expect single-tenant / working-renter base with shorter leases.
- Zoned schools: Woodland Elem. (math 32% / reading 32%, grade F, #761 of 1,115 statewide, top 72%, 347 students, 63% FRL); Woodland High (math 12% / reading 37%, grade F, #445 of 521 statewide, top 87%, 248 students, 51% FRL) — zoned schools at 57% FRL track the district average.
- Market conditions: 44 active listings in the ZIP.
- Bollinger County population projected at -14% by 2050 — secular population decline; favor cash flow + early exit over multi-decade hold.
- 2 sale attempts with the ask held roughly flat each time — persistent listings suggest the price (not the market) is what's stuck; bring a comps-based counter.
- At projected returns (3.0% appreciation + 3.0% rent growth), your $38k cash investment doubles in ~6 years — after that, you're playing with house money.
- By year 7, paydown + projected appreciation supports a ~$32k cash-out refi (75% LTV) — recoverable capital for the next deal without selling this one.
- Cap rate 6.4% vs local median 5.1% in Marble Hill — meaningfully above typical; check what's discounted (condition, days-on-market, listing class) to confirm the premium yield is real.
Questions for listing agent
- It's been on market 43 days. Have you received any prior offers? Is the seller open to a 12% concession, seller financing, or rate buy-down credit?
- Have any recent inspections been done? Can we get a copy of the seller's disclosures and any deferred-maintenance estimates?
- Built in 1962 — when were the roof, HVAC, electrical panel, plumbing, and water heater last replaced?
- Is there a deadline driving the sale (1031 exchange, divorce, estate, relocation)? That informs how much negotiation room exists.
- Schools are F-rated, which usually means shorter tenancies and higher turnover. Who's the typical renter profile here, and what's been the actual vacancy rate?
- The area grade is low — what's the realistic commute time and amenity access for the typical tenant pool here? Any planned neighborhood developments (good or bad) we should know about?
- What's the average days-on-market for RENTAL listings here right now (not sales)? A rising rental-DOM trend means longer vacancies and softer asking-rent achievability than the comps imply.
- What's the recent tenant-quality profile in this submarket — average credit score on applications, eviction rate, late-payment / NSF rate, and stable-employment percentage? A property-management company in the area should have these aggregated.
Repairs flagged (vision-AI assessment)
- Minor: exterior siding — Some discoloration visible on white siding
- Minor: interior walls — Some discoloration visible on interior walls
CashFlowRE · CFR-H0N5FS82KXTYSQ
· Data 2 days ago
cashflowre.app · 2026-05-29