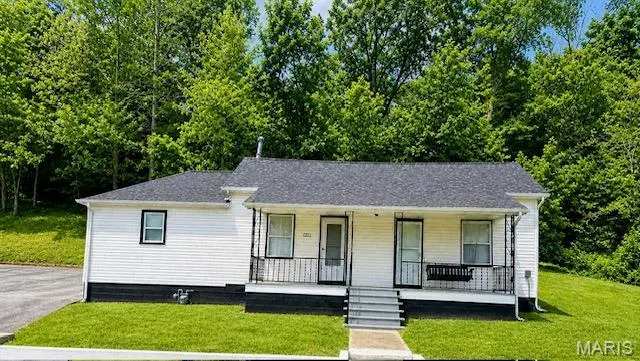
207 N 1st St · Marble Hill, MO
Flood risk No data
- FEMA flood zone
- —
- Chance of flooding over 30 yrs
- —
- Est. flood insurance / yr
- —
Fire risk No data
- Est. fire insurance / yr
- —
Heat risk No data
- Hot days now (above threshold)
- —
- Hot days in 30 yrs
- —
Wind risk No data
- Chance of severe wind over 30 yrs
- —
Air-quality risk No data
- Unhealthy air days now
- —
- Unhealthy air days in 30 yrs
- —
Risk factors via First Street. Map © Google.
Why this score? — see what drove the D grade
The composite is a weighted blend of 9 inputs, each scored 0–100. Each bar is that input's sub-score; the figure is the points it added to the 100-point composite (weight × sub-score).
- Cash flow +13.7/30.0
- Appreciation +5.0/10.0
- DSCR +4.2/10.0
- 1% rule +3.8/10.0
- Livability +3.0/5.0
- ARV discount +2.9/15.0
- Schools +2.8/10.0
- Rent growth +2.5/5.0
- Condition / age +2.2/5.0
$134,900
🖨 Deal sheet 📄 Offer letter ✓ Due diligence
Key facts
- 0.43 acre lot
- 2 garage spots
- Built 1962
Property features AI
Finance
- Financial info: Lease not considered
Exterior
- Parking: Concrete driveway; Attached garage (2-car)
- Security: Smoke detector(s)
- Utilities: Public water; Public sewer; Electricity connected (220 volts); Natural gas connected
- Home design: Single-family residence; One-story house; Updated/remodeled condition; Private ownership
- Construction: Vinyl siding; Shingle roof; Block foundation; Garage(s) on property; Built area above grade recorded by assessor
- Exterior features: Back yard; Adjoins common ground; City lot; Sloped up/steep slope; Concrete road frontage
Interior
- Kitchen: Microwave; Gas range; Refrigerator
- Bedrooms: 3 bedrooms (all on the main level)
- Flooring: Carpet; Wood
- Bathrooms: 2 full bathrooms (main level)
- Heating & cooling: Natural gas heating; Window air conditioning units; Other/none listed for additional heating
- Interior features: Eat-in kitchen; Crawl space basement; Front and side porches
- Laundry & utility: Dedicated laundry room; Washer and dryer included; Gas water heater
Neighborhood map
What this means for you Summary
Snapshot
- This is a 3-bed/2.0-bath single-family listed at $135k. Condition is rated fair.
Deal economics
- At list price, monthly cash flow is $11 ($129/yr) — positive.
- The deal already cash-flows at list — no discount required.
- To meet the 1% rule (rent ≥ 1% of price), the offer needs to be $119k (11.5% below list).
- Recommended offer: $119k (11.5% below list) — sets the bar for 1% rule.
- Cap rate 6.4% vs local median 5.1% in Marble Hill — meaningfully above typical; check what's discounted (condition, days-on-market, listing class) to confirm the premium yield is real.
Location & tenants
- Location reads 60/100 on livability (#508 in MO) — a middle-class / working-renter tenant base. Strengths: cost of living A+, crime A, housing A-; Watch: amenities F, commute F, employment F.
- Woodland R-IV (rural): math 27% / reading 42% proficiency, ranked #239 of 324 in MO (top 74%) — families likely to look elsewhere, expect single-tenant / working-renter base with shorter leases.
- Zoned schools: Woodland Elem. (math 32% / reading 32%, grade F, #761 of 1,115 statewide, top 72%, 347 students, 63% FRL); Woodland High (math 12% / reading 37%, grade F, #445 of 521 statewide, top 87%, 248 students, 51% FRL) — zoned schools at 57% FRL track the district average.
- Market conditions: 44 active listings in the ZIP.
Forward outlook
- In year one you build about $5k of equity ($933 loan paydown + $4k appreciation (3.0% local appreciation)).
- Bollinger County population projected at -14% by 2050 — secular population decline; favor cash flow + early exit over multi-decade hold.
- At projected returns (3.0% appreciation + 3.0% rent growth), your $38k cash investment doubles in ~6 years — after that, you're playing with house money.
- By year 7, paydown + projected appreciation supports a ~$32k cash-out refi (75% LTV) — recoverable capital for the next deal without selling this one.
Negotiation context
- It's been on market 43 days — a 3% lower offer ($131k) is reasonable based on typical stale-listing flexibility.
- 2 sale attempts with the ask held roughly flat each time — persistent listings suggest the price (not the market) is what's stuck; bring a comps-based counter.
Questions for the listing agent
- It's been on market 43 days. Have you received any prior offers? Is the seller open to a 12% concession, seller financing, or rate buy-down credit?
- Have any recent inspections been done? Can we get a copy of the seller's disclosures and any deferred-maintenance estimates?
- Built in 1962 — when were the roof, HVAC, electrical panel, plumbing, and water heater last replaced?
- Is there a deadline driving the sale (1031 exchange, divorce, estate, relocation)? That informs how much negotiation room exists.
- Schools are F-rated, which usually means shorter tenancies and higher turnover. Who's the typical renter profile here, and what's been the actual vacancy rate?
- The area grade is low — what's the realistic commute time and amenity access for the typical tenant pool here? Any planned neighborhood developments (good or bad) we should know about?
- What's the average days-on-market for RENTAL listings here right now (not sales)? A rising rental-DOM trend means longer vacancies and softer asking-rent achievability than the comps imply.
- What's the recent tenant-quality profile in this submarket — average credit score on applications, eviction rate, late-payment / NSF rate, and stable-employment percentage? A property-management company in the area should have these aggregated.
- How much new for-sale + rental construction is in the pipeline within 1–3 miles? Heavy new supply typically softens prices + rents 12–24 months out; constrained supply supports both.
Investment metrics
- 1% rule
- 0.88% ✗
- Cap rate
- 6.39%
- Cash-on-cash
- 0.34%
- DSCR
- 1.02
- GRM
- 9.4
CMA / ARV
- ARV (median comp)
- $122,286
- List price
- $134,900
- Delta
- 10.31%
- Verdict
- OVERPRICED
- Comps
- 20 within 1.0 mi
Show comp detail 12 sales within ~0.75 mi
| Address | Dist | Beds/Ba | Sqft | Sold | Price | $/sf | Match |
|---|---|---|---|---|---|---|---|
| 104 Railroad St | 0.12mi | 2/1.0 (-1) | 1,414 (+1%) | 11mo | $119,900 | $85 | 75 |
| 201 Central Ave | 0.22mi | 2/1.0 (-1) | 1,378 (-2%) | 11mo | $99,900 | $72 | 68 |
| 201 State Highway 51 | 0.35mi | 3/2.0 | 1,350 (-4%) | 12mo | $184,900 | $137 | 67 |
| 809 Crown St | 0.32mi | 2/1.0 (-1) | 1,336 (-5%) | 6mo | $120,000 | $90 | 62 |
| 2577 RR 2 | 0.14mi | 3/2.0 | 1,216 (-14%) | 11mo | $104,900 | $86 | 62 |
| 13721 Bcr 500 | 0.63mi | 3/1.0 | 1,375 (-2%) | 4mo | $99,900 | $73 | 60 |
| 713 Third St | 0.42mi | 3/1.0 | 1,306 (-7%) | 11mo | $135,000 | $103 | 56 |
| 305 Central Ave | 0.30mi | 3/2.0 | 1,206 (-14%) | 11mo | $119,900 | $99 | 53 |
| 25451 State Highway 51 | 0.62mi | 3/2.0 | 1,236 (-12%) | 0mo | $119,900 | $97 | 50 |
| 604 E Main St | 0.63mi | 3/1.0 | 1,538 (+9%) | 1mo | $64,500 | $42 | 50 |
| 800 Englehart Ln | 0.48mi | 3/2.0 | 1,200 (-15%) | 10mo | $179,900 | $150 | 45 |
| 206 Walnut St | 0.74mi | 4/2.0 (+1) | 1,296 (-8%) | 3mo | $189,500 | $146 | 45 |
Match score weights: distance 35% · size 25% · config 20% · recency 20%. Top-matched comps best support the ARV.
Projected returns pro-forma
3.0% appreciation · 3.0% rent growth · sell at horizon
- IRR
- 7.8%
- Equity multiple
- 1.45×
- Total profit
- $16,951
- Equity at exit
- $60,657
- IRR
- 10.5%
- Equity multiple
- 2.57×
- Total profit
- $59,434
- Equity at exit
- $93,479
Cash invested: $37,772 (down + closing). Projections, not guarantees.
Landlord ↔ Tenant lean methodology
- Overall (STATE)
- 81 Strongly Landlord-Friendly
- State Missouri
- 81 Strongly Landlord-Friendly · R+10
- County
- — inherits STATE
- City
- — inherits STATE
ZIP-level market 63764
- Active inventory
- 44
- Price-to-rent
- 9.4×
Monthly cashflow live
- Estimated rent
- $1,194 medium interval (Pro) →
- Mortgage (P&I)
- −$707
- Tax est. 1.5%
- −$169 /mo · $2,024/yr
- Insurance
- −$56
- HOA
- −$0
- Vacancy / Maint / Mgmt
- −$251
- Net cashflow
- $11
Break-even live
UW: 25.0% down · 7.5% · 30yr · 1.5% tax · 5.0% vac · 8.0% maint · 8.0% mgmt
Financing live
Cash to close
- Down payment
- $33,725
- Closing costs
- $4,047
- Reserves months
- —
- Total cash needed
- —
Loan-product check · same deal, 3 products live
Conventional
25% down · 7.5% · 30yr
- Down + closing
- —
- Monthly P&I
- —
- Monthly cashflow
- —
- DSCR
- —
- Eligible?
- —
Personal DTI + credit; lowest rate.
DSCR
20% down · 8.5% · 30yr
- Down + closing
- —
- Monthly P&I
- —
- Monthly cashflow
- —
- DSCR
- —
- Eligible?
- —
No personal income docs; deal must DSCR.
Hard money
10% down · 12.0% · 12mo
- Down + closing
- —
- Monthly P&I
- —
- Monthly cashflow
- —
- DSCR
- —
- Eligible?
- —
Short-term bridge; refi at stabilization.
Listing history 18 events
-
2026-06-18days on market $134,900 Active 43 DOM
-
2026-06-17days on market $134,900 Active 42 DOM
-
2026-06-16days on market $134,900 Active 41 DOM
-
2026-06-15days on market $134,900 Active 40 DOM
-
2026-06-13days on market $134,900 Active 38 DOM
-
2026-06-12days on market $134,900 Active 37 DOM
-
2026-06-09days on market $134,900 Active 34 DOM
-
2026-06-08days on market $134,900 Active 33 DOM
-
2026-06-07days on market $134,900 Active 32 DOM
-
2026-06-07days on market $134,900 Active 31 DOM
-
2026-06-04days on market $134,900 Active 28 DOM
-
2026-06-02pricedays on market $134,900 Active 27 DOM
-
2026-06-01days on market $139,000 Active 26 DOM
-
2026-05-31days on market $139,000 Active 25 DOM
-
2026-05-06$139,000 Active 678-char remark
-
2025-08-29price $145,000
-
2025-07-30price $149,000
-
2025-07-26$149,900 Active
ⓘ Source: listings_history table (triggers on properties + properties_extension) + one-shot
backfill from property_details.listing_events for pre-trigger history.
Nearby sold comps map
Loading sold comps map…
Walkable amenities ~0.75 mi
Loading nearby amenities…
Taxation est. · year 1
- Rental income
- $14,324
- − Mortgage interest
- −$7,556
- − Property taxes
- −$2,024
- − Insurance
- −$674
- − Repairs & maintenance
- −$1,146
- − Management
- −$1,146
- − Depreciation
- −$3,924
- Taxable loss
- −$2,147
- Est. tax savings @ 24.0%
- +$515
- After-tax cash flow
- $644/yr
For passive investors: Depreciation is non-cash, so a rental often shows a tax loss while cash-flowing — sheltering income. Rental losses are passive: they offset passive income freely, and up to $25,000/yr can offset ordinary (W-2) income if you actively participate and your MAGI is under $100k (phasing out to $0 by $150k); unused losses carry forward. On sale, claimed depreciation is recaptured at up to 25%, and gains may owe capital-gains tax (a 1031 exchange can defer both). Figures are a year-1 estimate at your 24.0% rate — not tax advice; consult a CPA.
Condition & rehab AI · 12 photos
This home is move-in ready with cosmetic updates, but some minor repairs and maintenance are needed to enhance its value.
Repairs flagged
- Minor exterior siding — Some discoloration visible on white siding
- Minor interior walls — Some discoloration visible on interior walls
Value-add opportunities
- Both Paint interior walls — Fresh paint enhances curb appeal and interior aesthetics
- Resale Replace carpet with hardwood flooring — Hardwood flooring is more durable and aesthetically pleasing
- Resale Replace exterior siding — Fresh siding improves curb appeal and home value
Renovation cost estimate screening
| Repair item | Severity | Est. cost |
|---|---|---|
| exterior siding · Some discoloration visible on white siding | Minor | $500–3,000 |
| interior walls · Some discoloration visible on interior walls | Minor | $500–3,000 |
| Total estimated repair cost · 2 items | $1,000–6,000 |
Value-add ROI direction
- Both Paint interior walls — Fresh paint enhances curb appeal and interior aesthetics ↑
- Resale Replace carpet with hardwood flooring — Hardwood flooring is more durable and aesthetically pleasing ↑
- Resale Replace exterior siding — Fresh siding improves curb appeal and home value ↑
ⓘ Cost ranges are severity-bucket heuristics (US national rule-of-thumb). Get contractor quotes + a written scope before underwriting a rehab budget.
Schools (NCES district)
- District
- Woodland R-IV
- NCES district ID
- 2919350
- Math proficiency
- 27% ▼ -10.00%
- Reading proficiency
- 42% ▼ -2.00%
- Median HH income
- $32,564
- Composite
- 28.21/100
- National rank
- #6804
- State rank
- #239 of 324 in MO
Livability — Marble Hill
- Score
- 60/100
- State rank
- #508
- US rank
- #19511
Category grades
Schools grade is shown separately in the Schools card above.
Census & demographics
- Census place
- Marble Hill, MO
- Population (ZIP)
- 4,568
Population outlook (Bollinger County) Hauer SSP2
- Today (2025)
- 11,825 people
- By 2030
- 11,546 · -2.4%
- By 2040
- 10,935 · -7.5%
- By 2050
- 10,222 · -13.6%
- By 2075
- 8,396 · -29.0%
- By 2100
- 6,530 · -44.8%
Race, ethnicity, and origin ACS 2023
- Neighborhood character
- Predominantly White (89%)
- Race & ethnicity
- White 89% Two or more races 6% Hispanic / Latino 3% Black 1%
- Common ancestry
- Iranian 5% Lithuanian 3% Serbian 2%
- Foreign-born
- 0%
Political lean MEDSL · Bollinger
- 2024 margin
- Solid R (+74.8) · D 12.3% · R 87.1%
- 2008→2024 swing
- -35.4pp toward R · 2008: -39.5pp · 2024: -74.8pp
- All cycles
- 2024: R+74.8 2020: R+73.8 2016: R+72.7 2012: R+52.8 2008: R+39.5
Not yet ingested
- Civics
- —
Market trends
- HPI YoY
- —
- Current HPI
- —
- Rent YoY
- —
- Metro
- —
- State GDP YoY
- ▲ 1.84%
- F500 in state
- 20
Industry mix (Fortune 500 HQ in MO)
| Industry | F500 HQs | Revenue |
|---|---|---|
| Healthcare | 1 | $163B |
|
||
| Insurance | 1 | $21B |
|
||
| Industrial Technology | 1 | $17B |
|
||
| Retail | 1 | $16B |
|
||
| Industrial Distribution | 1 | $10B |
|
||
| Utilities | 1 | $9B |
|
||
Price history
-10.0% since first listed5 events — show timeline
- 2026-06-01 Price Changed $134,900 MARIS as Distributed by MLS Grid
- 2026-05-06 Listed $139,000 MARIS as Distributed by MLS Grid
- 2025-08-29 Price Changed $145,000 MARIS as Distributed by MLS Grid
- 2025-07-30 Price Changed $149,000 MARIS as Distributed by MLS Grid
- 2025-07-26 Listed $149,900 MARIS as Distributed by MLS Grid
Cash-flow waterfall
monthlySold comps — $/sqft
last 12 mo · ≤1 miLoading sold comps…