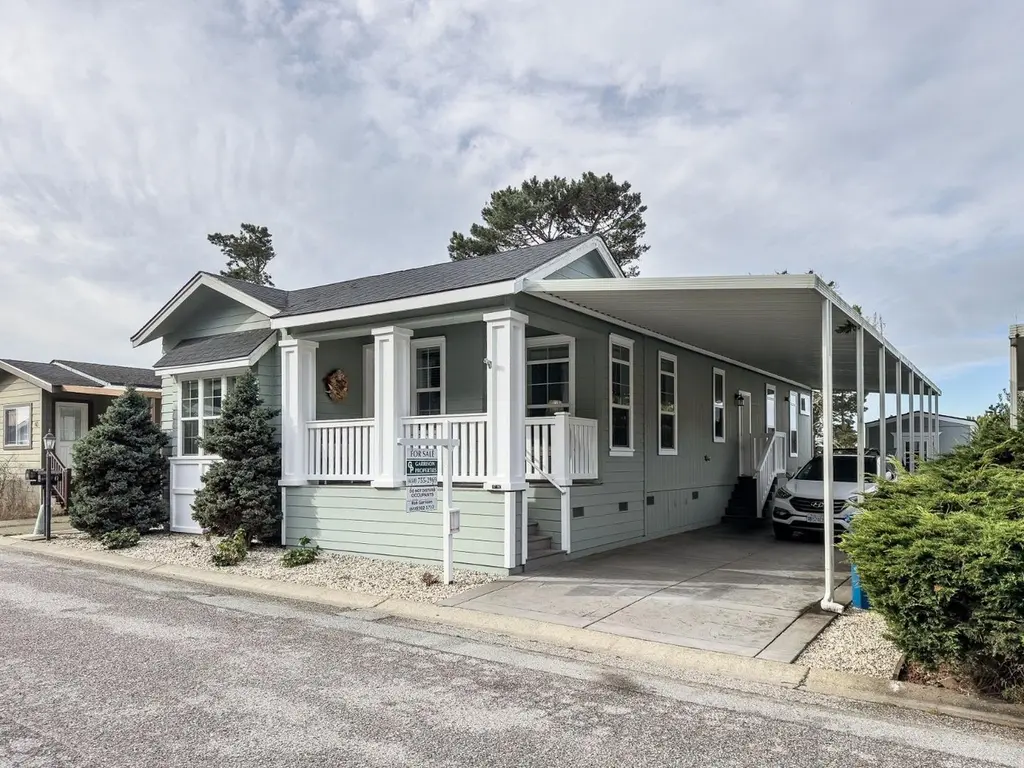
47 Yacht Ln #096
Daly City, CA 94014
$499,000D-
3 bd · 2.5 ba ·
1,770 sqft ·
Built 2014
· Manufactured
· Active
· 27 DOM
Cashflow @ list (25.0% down · 7.5%)
Estimated rent
$4,486/mo
Mortgage (P&I)
−$2,617
Tax + insurance
−$832
HOA
−$0
Vac / Maint / Mgmt
−$942
Net cashflow
$95/mo
Annual
$1,143/yr
Cap rate
6.52%
Cash-on-cash
0.82%
DSCR
1.04
1% rule
0.90%
Cash to close
$139,720
Investor read
- This is a 3-bed/2.5-bath manufactured listed at $499k.
- At list price, monthly cash flow is $95 ($1k/yr) — positive.
- The deal already cash-flows at list — no discount required.
- To meet the 1% rule (rent ≥ 1% of price), the offer needs to be $449k (10.1% below list).
- It's been on market 27 days — a 2% lower offer ($492k) is reasonable based on typical stale-listing flexibility.
- Recommended offer: $449k (10.1% below list) — sets the bar for 1% rule.
- Local home prices are declining (-3.0%/yr); year-one equity from $3k of loan paydown is wiped out by about $15k of value loss. Plan a longer hold.
- Location reads 82/100 on livability (#35 in CA, #1,221 nationally) — a professional / high-income tenant draw. Strengths: amenities A+, commute A+, employment A+; Watch: cost of living F.
- Jefferson Union High (suburban): math 50% / reading 75% proficiency, ranked #66 of 517 in CA (top 13%) — acceptable for families but not a draw, mixed tenant base, ~2y average lease.
- Market conditions: Rents rising fast (+7.1%/yr); 60 active listings in the ZIP; 4 comparable units currently listed for rent nearby; rentals leasing fast (median 2d on market — plan ~1-2 weeks tenant-placement turnaround); high-income renter base; 1,019 units permitted in San Mateo County in 2024 (484 in 5+ unit buildings).
- San Mateo County population projected at +24% by 2050 — long-run rental-demand tailwind backs the buy-and-hold thesis.
- 3 sale attempts since 26y ago with the ask held roughly flat each time — persistent listings suggest the price (not the market) is what's stuck; bring a comps-based counter.
- Current owner paid $90k; list at $499k implies a 454% gain — meaningful room to come down on a strong offer.
- Cap rate 6.5% vs local median 2.2% in Daly City — top-decile yield for the area; either an underpriced asset or a hidden risk that comps aren't pricing in. Stress-test before assuming the spread holds.
- This rent runs 44% of the median local income ($123k/yr) — at the standard rent-burdened threshold; future hikes will face affordability resistance.
Questions for listing agent
- Is there a deadline driving the sale (1031 exchange, divorce, estate, relocation)? That informs how much negotiation room exists.
- The area grade is low — what's the realistic commute time and amenity access for the typical tenant pool here? Any planned neighborhood developments (good or bad) we should know about?
- What's the average days-on-market for RENTAL listings here right now (not sales)? A rising rental-DOM trend means longer vacancies and softer asking-rent achievability than the comps imply.
- What's the recent tenant-quality profile in this submarket — average credit score on applications, eviction rate, late-payment / NSF rate, and stable-employment percentage? A property-management company in the area should have these aggregated.
- How much new for-sale + rental construction is in the pipeline within 1–3 miles? Heavy new supply typically softens prices + rents 12–24 months out; constrained supply supports both.
CashFlowRE · CFR-H1GF7H8NSA0W7P
· Data 2 days ago
cashflowre.app · 2026-05-29