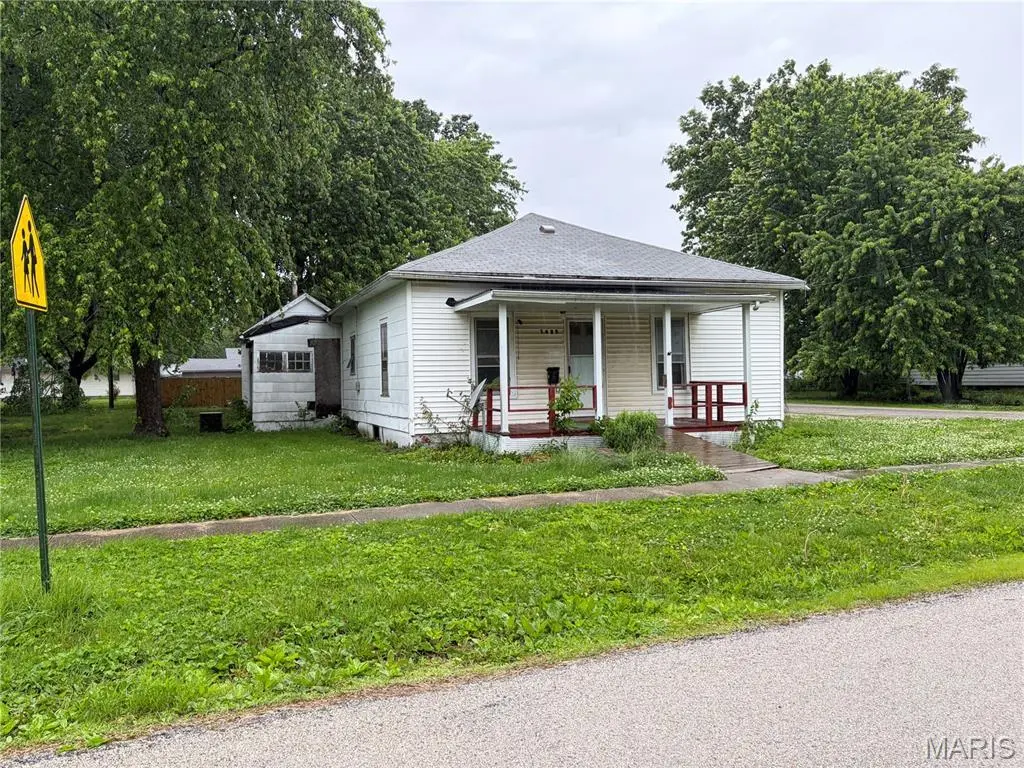
1425 N Madison St
Litchfield, IL 62056
$17,500D
3 bd · 1.0 ba ·
1,175 sqft ·
Built 1950
· SingleFamily
· Pending
· 31 DOM
Cashflow @ list (25.0% down · 7.5%)
Estimated rent
$1,002/mo
Mortgage (P&I)
−$92
Tax + insurance
−$29
HOA
−$0
Vac / Maint / Mgmt
−$210
Net cashflow
$671/mo
Annual
$8,050/yr
Cap rate
52.29%
Cash-on-cash
164.28%
DSCR
8.31
1% rule
5.73%
Cash to close
$4,900
Investor read
- This is a 3-bed/1.0-bath single-family listed at $18k.
- At list price, monthly cash flow is $671 ($8k/yr) — positive.
- The deal already cash-flows at list — no discount required.
- Meets the 1% rule at list price ($1k rent vs $18k).
- It's been on market 31 days — a 3% lower offer ($17k) is reasonable based on typical stale-listing flexibility.
- Recommended offer: $17k (3.0% below list) — sets the bar for market timing.
- Local home prices are declining (-3.0%/yr); year-one equity from $121 of loan paydown is wiped out by about $525 of value loss. Plan a longer hold.
- Location reads 68/100 on livability (#448 in IL) — a middle-class / working-renter tenant base. Strengths: cost of living A+, housing A+, health & safety A+; Watch: crime C-, employment D+, amenities F.
- Litchfield CUSD 12 (town): math 15% / reading 34% proficiency, ranked #359 of 620 in IL (top 58%) — low school quality limits family demand, transient renter base, plan for 1-2y turnover.
- Zoned schools: Litchfield Senior High School (math 22% / reading 27%, grade F, #256 of 693 statewide, top 44%, 411 students, 0% FRL) — zoned schools average 0% FRL vs 49% district-wide (49 pts lower); this property's tenant base skews higher-income than the district average.
- Watch-outs: built in 1950 — expect roof / HVAC / electrical / plumbing capex.
- Market conditions: 59 active listings in the ZIP; 12 units permitted in Montgomery County in 2024 (0 in 5+ unit buildings).
- Montgomery County population projected at -20% by 2050 — secular population decline; favor cash flow + early exit over multi-decade hold.
- At projected returns (-3.0% appreciation + 3.0% rent growth), your $5k cash investment doubles in ~1 year — after that, you're playing with house money.
- Cap rate 52.3% vs local median 4.5% in Litchfield — top-decile yield for the area; either an underpriced asset or a hidden risk that comps aren't pricing in. Stress-test before assuming the spread holds.
Questions for listing agent
- It's been on market 31 days. Have you received any prior offers? Is the seller open to a 3% concession, seller financing, or rate buy-down credit?
- Built in 1950 — when were the roof, HVAC, electrical panel, plumbing, and water heater last replaced?
- Is there a deadline driving the sale (1031 exchange, divorce, estate, relocation)? That informs how much negotiation room exists.
- Schools are F-rated, which usually means shorter tenancies and higher turnover. Who's the typical renter profile here, and what's been the actual vacancy rate?
- The area grade is low — what's the realistic commute time and amenity access for the typical tenant pool here? Any planned neighborhood developments (good or bad) we should know about?
- What's the average days-on-market for RENTAL listings here right now (not sales)? A rising rental-DOM trend means longer vacancies and softer asking-rent achievability than the comps imply.
- What's the recent tenant-quality profile in this submarket — average credit score on applications, eviction rate, late-payment / NSF rate, and stable-employment percentage? A property-management company in the area should have these aggregated.
- How much new for-sale + rental construction is in the pipeline within 1–3 miles? Heavy new supply typically softens prices + rents 12–24 months out; constrained supply supports both.
CashFlowRE · CFR-H2ZF1K0KQJ9JCG
· Data 2 days ago
cashflowre.app · 2026-05-29