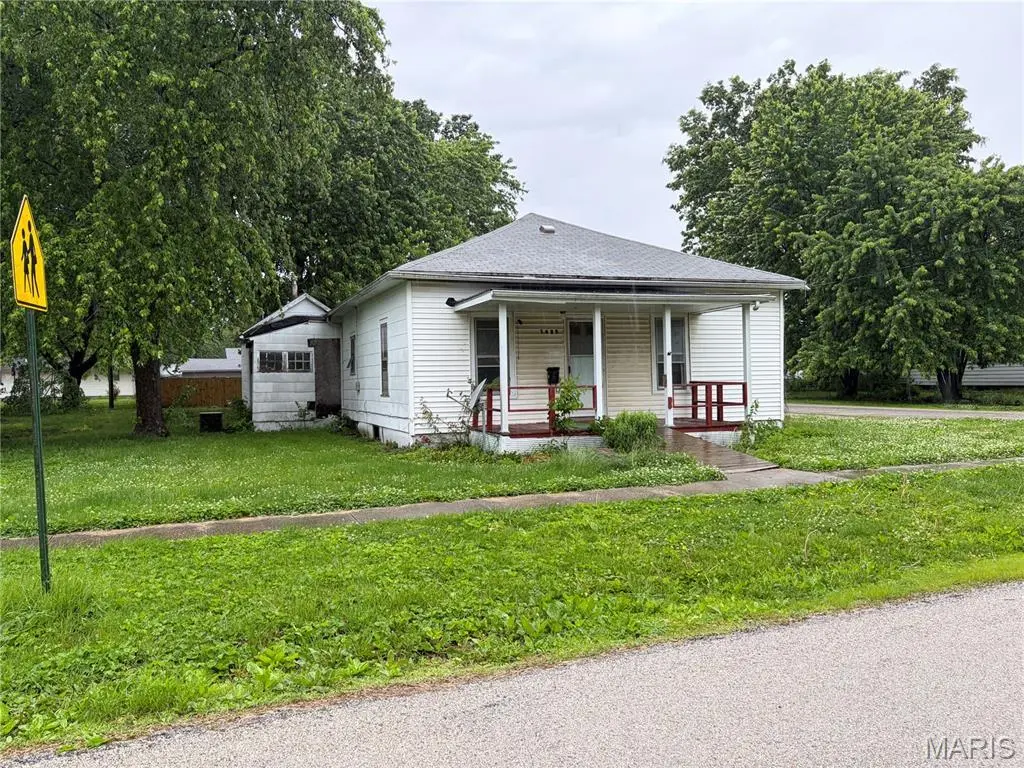
1425 N Madison St · Litchfield, IL
Flood risk 1/10 · Minimal
- FEMA flood zone
- X
- Chance of flooding over 30 yrs
- 0.0%
- Est. flood insurance / yr
- $473 – $860
Fire risk 1/10 · Minimal
- Est. fire insurance / yr
- $804 – $1,492
Heat risk 4/10 · Minor
- Hot days now (above 106°F)
- 7 days/yr
- Hot days in 30 yrs
- 20 days/yr
Wind risk 2/10 · Minimal
- Chance of severe wind over 30 yrs
- 1.0%
Air-quality risk 2/10 · Minimal
- Unhealthy air days now
- 1 days/yr
- Unhealthy air days in 30 yrs
- 1 days/yr
Risk factors via First Street. Map © Google.
Why this score? — see what drove the D grade
The composite is a weighted blend of 9 inputs, each scored 0–100. Each bar is that input's sub-score; the figure is the points it added to the 100-point composite (weight × sub-score).
- Cash flow +15.0/30.0
- ARV discount +7.5/15.0
- 1% rule +5.0/10.0
- DSCR +5.0/10.0
- Livability +3.4/5.0
- Rent growth +2.5/5.0
- Condition / age +2.5/5.0
- Schools +2.1/10.0
- Appreciation +0.0/10.0
$17,500
🖨 Deal sheet 📄 Offer letter ✓ Due diligence
Listing remarks
INVESTORS WANTED! See if this is the project for you! Selling AS IS, power and water are off. The house has 3 bedrooms, a spacious living area, and a 1 car detached garage. The home needs a lot of TLC. Interior pics coming soon. No contract for deed. Will not pass any inspections.
Key facts
- 7,936 sq ft lot
- Garage
- Built 1950
Property features AI
Exterior
- Parking: 1-car garage
- Utilities: Public water; Public sewer; Electric service by Ameren; Natural gas connected; Electricity connected; Sewer connected; Water connected
- Home design: Single-family residence; One story
- Construction: Built year: estimated; Construction material: Other
- Exterior features: Corner lot
Interior
- Bedrooms: 3 bedrooms, all on the main level
- Bathrooms: 1 full bathroom (main level)
- Heating & cooling: No heating system listed; No cooling system listed
- Interior features: Partial basement
Neighborhood map
What this means for you Summary
Snapshot
- This is a 3-bed/1.0-bath single-family listed at $18k.
Deal economics
- At list price, monthly cash flow is $671 ($8k/yr) — positive.
- The deal already cash-flows at list — no discount required.
- Meets the 1% rule at list price ($1k rent vs $18k).
- Recommended offer: $17k (3.0% below list) — sets the bar for market timing.
- Cap rate 52.3% vs local median 4.5% in Litchfield — top-decile yield for the area; either an underpriced asset or a hidden risk that comps aren't pricing in. Stress-test before assuming the spread holds.
Location & tenants
- Location reads 68/100 on livability (#448 in IL) — a middle-class / working-renter tenant base. Strengths: cost of living A+, housing A+, health & safety A+; Watch: crime C-, employment D+, amenities F.
- Litchfield CUSD 12 (town): math 15% / reading 34% proficiency, ranked #359 of 620 in IL (top 58%) — low school quality limits family demand, transient renter base, plan for 1-2y turnover.
- Zoned schools: Litchfield Senior High School (math 22% / reading 27%, grade F, #256 of 693 statewide, top 44%, 411 students, 0% FRL) — zoned schools average 0% FRL vs 49% district-wide (49 pts lower); this property's tenant base skews higher-income than the district average.
- Market conditions: 59 active listings in the ZIP; 12 units permitted in Montgomery County in 2024 (0 in 5+ unit buildings).
Forward outlook
- Local home prices are declining (-3.0%/yr); year-one equity from $121 of loan paydown is wiped out by about $525 of value loss. Plan a longer hold.
- Montgomery County population projected at -20% by 2050 — secular population decline; favor cash flow + early exit over multi-decade hold.
- At projected returns (-3.0% appreciation + 3.0% rent growth), your $5k cash investment doubles in ~1 year — after that, you're playing with house money.
Negotiation context
- It's been on market 31 days — a 3% lower offer ($17k) is reasonable based on typical stale-listing flexibility.
Risks & watch-outs
- Watch-outs: built in 1950 — expect roof / HVAC / electrical / plumbing capex.
Questions for the listing agent
- It's been on market 31 days. Have you received any prior offers? Is the seller open to a 3% concession, seller financing, or rate buy-down credit?
- Built in 1950 — when were the roof, HVAC, electrical panel, plumbing, and water heater last replaced?
- Is there a deadline driving the sale (1031 exchange, divorce, estate, relocation)? That informs how much negotiation room exists.
- Schools are F-rated, which usually means shorter tenancies and higher turnover. Who's the typical renter profile here, and what's been the actual vacancy rate?
- The area grade is low — what's the realistic commute time and amenity access for the typical tenant pool here? Any planned neighborhood developments (good or bad) we should know about?
- What's the average days-on-market for RENTAL listings here right now (not sales)? A rising rental-DOM trend means longer vacancies and softer asking-rent achievability than the comps imply.
- What's the recent tenant-quality profile in this submarket — average credit score on applications, eviction rate, late-payment / NSF rate, and stable-employment percentage? A property-management company in the area should have these aggregated.
- How much new for-sale + rental construction is in the pipeline within 1–3 miles? Heavy new supply typically softens prices + rents 12–24 months out; constrained supply supports both.
Investment metrics
- 1% rule
- 5.73% ✓
- Cap rate
- 52.29%
- Cash-on-cash
- 164.28%
- DSCR
- 8.31
- GRM
- 1.5
CMA / ARV
- ARV (on-the-fly)
- $130,425
- Comps found
- 12
Show comp detail 12 sales within ~0.75 mi
| Address | Dist | Beds/Ba | Sqft | Sold | Price | $/sf | Match |
|---|---|---|---|---|---|---|---|
| 1402 N Harrison St | 0.35mi | 3/1.0 | 1,168 (-1%) | 3mo | $148,000 | $127 | 80 |
| 123 Ferdon | 0.24mi | 3/1.0 | 1,150 (-2%) | 8mo | $88,000 | $77 | 79 |
| 1003 N Monroe St | 0.31mi | 3/1.0 | 1,120 (-5%) | 3mo | $92,000 | $82 | 75 |
| 1103 N Madison | 0.23mi | 3/1.0 | 1,248 (+6%) | 9mo | $85,000 | $68 | 71 |
| 704 N Monroe St | 0.47mi | 3/2.0 | 1,192 (+1%) | 2mo | $167,000 | $140 | 70 |
| 1600 N Harrison St | 0.35mi | 3/1.5 | 1,232 (+5%) | 7mo | $149,900 | $122 | 68 |
| 421 E Hauser St | 0.41mi | 2/1.0 (-1) | 1,151 (-2%) | 9mo | $35,000 | $30 | 64 |
| 1521 N Jackson St | 0.20mi | 3/1.0 | 1,321 (+12%) | 7mo | $124,900 | $95 | 64 |
| 38 Northcrest Dr | 0.49mi | 3/1.0 | 1,080 (-8%) | 4mo | $120,000 | $111 | 60 |
| 413 E Beach St | 0.44mi | 3/1.0 | 1,282 (+9%) | 7mo | $164,900 | $129 | 58 |
| 701 E Clark St | 0.47mi | 2/1.0 (-1) | 1,027 (-13%) | 9mo | $105,000 | $102 | 44 |
| 35 Northcrest Dr | 0.46mi | 2/2.0 (-1) | 1,000 (-15%) | 7mo | $119,900 | $120 | 38 |
Match score weights: distance 35% · size 25% · config 20% · recency 20%. Top-matched comps best support the ARV.
Projected returns pro-forma
-3.0% appreciation · 3.0% rent growth · sell at horizon
- IRR
- —
- Equity multiple
- 9.14×
- Total profit
- $39,904
- Equity at exit
- $2,609
- IRR
- —
- Equity multiple
- 19.33×
- Total profit
- $89,825
- Equity at exit
- $1,513
Cash invested: $4,900 (down + closing). Projections, not guarantees.
Landlord ↔ Tenant lean methodology
- Overall (STATE)
- 43 Moderately Tenant-Leaning
- State Illinois
- 43 Moderately Tenant-Leaning · D+7
- County
- — inherits STATE
- City
- — inherits STATE
ZIP-level market 62056
- Home prices YoY
- -26.5%
- Active inventory
- 59
- Price-to-rent
- 1.5×
Monthly cashflow live
- Estimated rent
- $1,002 medium interval (Pro) →
- Mortgage (P&I)
- −$92
- Tax est. 1.5%
- −$22 /mo · $262/yr
- Insurance
- −$7
- HOA
- −$0
- Vacancy / Maint / Mgmt
- −$210
- Net cashflow
- $671
Break-even live
UW: 25.0% down · 7.5% · 30yr · 1.5% tax · 5.0% vac · 8.0% maint · 8.0% mgmt
Financing live
Cash to close
- Down payment
- $4,375
- Closing costs
- $525
- Reserves months
- —
- Total cash needed
- —
Loan-product check · same deal, 3 products live
Conventional
25% down · 7.5% · 30yr
- Down + closing
- —
- Monthly P&I
- —
- Monthly cashflow
- —
- DSCR
- —
- Eligible?
- —
Personal DTI + credit; lowest rate.
DSCR
20% down · 8.5% · 30yr
- Down + closing
- —
- Monthly P&I
- —
- Monthly cashflow
- —
- DSCR
- —
- Eligible?
- —
No personal income docs; deal must DSCR.
Hard money
10% down · 12.0% · 12mo
- Down + closing
- —
- Monthly P&I
- —
- Monthly cashflow
- —
- DSCR
- —
- Eligible?
- —
Short-term bridge; refi at stabilization.
Listing history 18 events
-
2026-06-18status $17,500 Pending 31 DOM
-
2026-06-18days on market $17,500 Active Under Contract 31 DOM
-
2026-06-18status $17,500 Active Under Contract 30 DOM
-
2026-06-17days on market $17,500 Active 30 DOM
-
2026-06-16days on market $17,500 Active 29 DOM
-
2026-06-15days on market $17,500 Active 28 DOM
-
2026-06-13days on market $17,500 Active 26 DOM
-
2026-06-12days on market $17,500 Active 25 DOM
-
2026-06-09days on market $17,500 Active 22 DOM
-
2026-06-08days on market $17,500 Active 21 DOM
-
2026-06-07days on market $17,500 Active 20 DOM
-
2026-06-07days on market $17,500 Active 19 DOM
-
2026-06-04days on market $17,500 Active 16 DOM
-
2026-06-02days on market $17,500 Active 15 DOM
-
2026-06-01days on market $17,500 Active 14 DOM
-
2026-05-31days on market $17,500 Active 13 DOM
-
2026-05-31days on market $17,500 Active 12 DOM
-
2026-05-18$17,500 Active
ⓘ Source: listings_history table (triggers on properties + properties_extension) + one-shot
backfill from property_details.listing_events for pre-trigger history.
Climate risk First Street
- Flood 1/10 Low FEMA zone X · 0% chance over 30 yrs
- Wildfire 1/10 Low
- Heat 4/10 Moderate 7 d/yr ≥106°F today · 20 d/yr by 30 yrs out
- Wind 2/10 Low 100% chance of damaging wind over 30 yrs
- Air quality 2/10 Low 1 unhealthy d/yr today · 1 by 30 yrs out
Nearby sold comps map
Loading sold comps map…
Walkable amenities ~0.75 mi
Loading nearby amenities…
Taxation est. · year 1
- Rental income
- $12,027
- − Mortgage interest
- −$980
- − Property taxes
- −$262
- − Insurance
- −$88
- − Repairs & maintenance
- −$962
- − Management
- −$962
- − Depreciation
- −$509
- Taxable income
- $8,263
- Est. tax owed @ 24.0%
- −$1,983
- After-tax cash flow
- $6,067/yr
For passive investors: Depreciation is non-cash, so a rental often shows a tax loss while cash-flowing — sheltering income. Rental losses are passive: they offset passive income freely, and up to $25,000/yr can offset ordinary (W-2) income if you actively participate and your MAGI is under $100k (phasing out to $0 by $150k); unused losses carry forward. On sale, claimed depreciation is recaptured at up to 25%, and gains may owe capital-gains tax (a 1031 exchange can defer both). Figures are a year-1 estimate at your 24.0% rate — not tax advice; consult a CPA.
Schools (NCES district)
- District
- Litchfield CUSD 12
- NCES district ID
- 1723250
- Math proficiency
- 15% ▼ -5.00%
- Reading proficiency
- 34% ▼ -8.00%
- Median HH income
- $43,133
- Composite
- 20.91/100
- National rank
- #8485
- State rank
- #359 of 620 in IL
Livability — Litchfield
- Score
- 68/100
- State rank
- #448
- US rank
- #9263
Category grades
Schools grade is shown separately in the Schools card above.
Census & demographics
- Census place
- Litchfield, IL
- City population
- 8,591
- Population (ZIP)
- 8,591
Population outlook (Montgomery County) Hauer SSP2
- Today (2025)
- 27,471 people
- By 2030
- 26,410 · -3.9%
- By 2040
- 24,233 · -11.8%
- By 2050
- 21,948 · -20.1%
- By 2075
- 16,686 · -39.3%
- By 2100
- 11,369 · -58.6%
Race, ethnicity, and origin ACS 2023
- Neighborhood character
- Predominantly White (99%)
- Race & ethnicity
- White 99%
- Common ancestry
- Slovak 3% Lithuanian 2% Romanian 1%
- Foreign-born
- 1%
Political lean MEDSL · Montgomery
- 2024 margin
- Solid R (+44.0) · D 27.1% · R 71.1% · Other 1.8%
- 2008→2024 swing
- -46.7pp toward R · 2008: 2.6pp · 2024: -44.0pp
- All cycles
- 2024: R+44.0 2020: R+41.0 2016: R+40.0 2012: R+14.2 2008: D+2.6
Not yet ingested
- Civics
- —
Market trends
- HPI YoY
- ▼ -53.86%
- Current HPI
- 149.5766
- Rent YoY
- —
- Metro
- —
- State GDP YoY
- ▲ 1.59%
- F500 in state
- 60
Industry mix (Fortune 500 HQ in IL)
| Industry | F500 HQs | Revenue |
|---|---|---|
| Insurance | 4 | $201B |
|
||
| Consumer Goods | 4 | $87B |
|
||
| Industrial Machinery | 3 | $64B |
|
||
| Healthcare | 2 | $55B |
|
||
| Retail / Pharmacy | 1 | $148B |
|
||
| Agriculture / Food | 1 | $86B |
|
||
Price history
1 event — show timeline
- 2026-05-18 Listed $17,500 MARIS as Distributed by MLS Grid
Property tax history
+2.1%/yrLatest (2024): $1,205 · +4.0% YoY. Source: county tax records.
Cash-flow waterfall
monthlySold comps — $/sqft
last 12 mo · ≤1 miLoading sold comps…