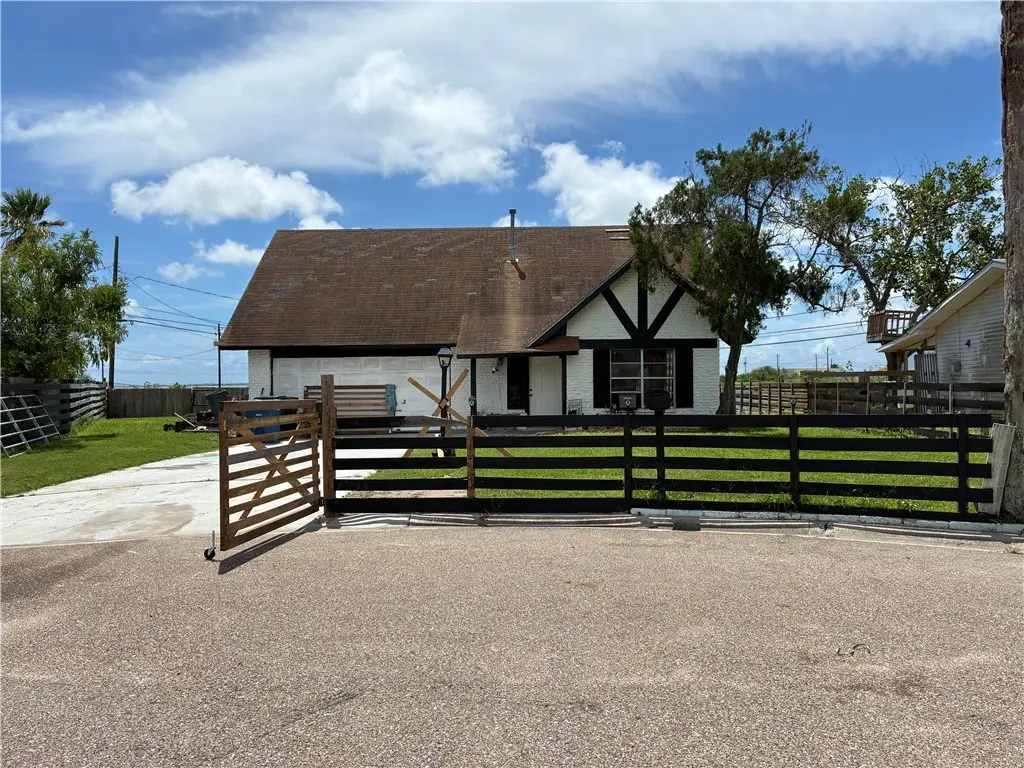
3007 Bimini Dr
Corpus Christi, TX 78418
$130,000B+
3 bd · 1.5 ba ·
1,106 sqft ·
Built 1964
· SingleFamily
· Active
· 12 DOM
Cashflow @ list (25.0% down · 7.5%)
Estimated rent
$2,046/mo
Mortgage (P&I)
−$682
Tax + insurance
−$721
HOA
−$0
Vac / Maint / Mgmt
−$430
Net cashflow
$213/mo
Annual
$2,559/yr
Cap rate
12.20%
Cash-on-cash
21.09%
DSCR
1.94
1% rule
1.57%
Cash to close
$36,400
Investor read
- This is a 3-bed/1.5-bath single-family listed at $130k.
- At list price, monthly cash flow is $213 ($3k/yr) — positive.
- The deal already cash-flows at list — no discount required.
- Meets the 1% rule at list price ($2k rent vs $130k).
- Only 12 days on market — expect competitive offers; lowballing is unlikely to land.
- Local home prices are declining (-3.0%/yr); year-one equity from $899 of loan paydown is wiped out by about $4k of value loss. Plan a longer hold.
- Location reads 78/100 on livability (#66 in TX, #2,404 nationally) — a middle-class / working-renter tenant base. Strengths: commute A+, cost of living A+, housing A+; Watch: crime F.
- Flour Bluff ISD (urban): math 43% / reading 51% proficiency, ranked #209 of 826 in TX (top 25%) — families likely to look elsewhere, expect single-tenant / working-renter base with shorter leases.
- Watch-outs: flood insurance adds $427/mo.
- Market conditions: Rents soft (-0.6%/yr); 685 active listings in the ZIP; 6 comparable units currently listed for rent nearby; rentals lingering (median 44d on market — plan ~5-8 weeks vacancy on turnover, expect pricing pressure); 50% of comp listings sitting > 30 days — soft ceiling on asking rent; solid renter incomes; 1,397 units permitted in Nueces County in 2024 (47 in 5+ unit buildings).
- Nueces County population projected at +36% by 2050 — long-run rental-demand tailwind backs the buy-and-hold thesis.
- Current owner paid $14k; list at $130k implies a 803% gain — meaningful room to come down on a strong offer.
- Climate carrying-cost: in FEMA flood zone AE (mandatory federal flood insurance); severe wind risk, 99% chance of damaging wind over 30y; extreme-heat days projected 7→28/yr by 2055 (HVAC capex compounding) — expect insurance premiums to compound above CPI over the hold.
- Cap rate 12.2% vs local median 3.6% in Corpus Christi — top-decile yield for the area; either an underpriced asset or a hidden risk that comps aren't pricing in. Stress-test before assuming the spread holds.
Questions for listing agent
- Built in 1964 — when were the roof, HVAC, electrical panel, plumbing, and water heater last replaced?
- What's the actual annual flood-insurance premium (NFIP or private), and is the property in a SFHA with mandatory coverage?
- Is there a deadline driving the sale (1031 exchange, divorce, estate, relocation)? That informs how much negotiation room exists.
- Crime grade is F in this area — have there been break-ins, vandalism, or insurance claims at this property in the last 3 years? What carrier currently insures it and at what premium?
- What's the average days-on-market for RENTAL listings here right now (not sales)? A rising rental-DOM trend means longer vacancies and softer asking-rent achievability than the comps imply.
- What's the recent tenant-quality profile in this submarket — average credit score on applications, eviction rate, late-payment / NSF rate, and stable-employment percentage? A property-management company in the area should have these aggregated.
- How much new for-sale + rental construction is in the pipeline within 1–3 miles? Heavy new supply typically softens prices + rents 12–24 months out; constrained supply supports both.
CashFlowRE · CFR-H30ZFCBP5VT5FJ
· Data 2 days ago
cashflowre.app · 2026-05-29