3007 Bimini Dr · Corpus Christi, TX
Flood risk 9/10 · Severe
- FEMA flood zone
- AE
- Chance of flooding over 30 yrs
- 0.99%
- Est. flood insurance / yr
- $1,737 – $8,500
Fire risk 3/10 · Minor
- Est. fire insurance / yr
- $1,222 – $2,270
Heat risk 10/10 · Severe
- Hot days now (above 108°F)
- 7 days/yr
- Hot days in 30 yrs
- 28 days/yr
Wind risk 9/10 · Severe
- Chance of severe wind over 30 yrs
- 99.0%
Air-quality risk 1/10 · Minimal
- Unhealthy air days now
- 0 days/yr
- Unhealthy air days in 30 yrs
- 0 days/yr
Risk factors via First Street. Map © Google.
Why this score? — see what drove the B+ grade
The composite is a weighted blend of 9 inputs, each scored 0–100. Each bar is that input's sub-score; the figure is the points it added to the 100-point composite (weight × sub-score).
- Cash flow +30.0/30.0
- ARV discount +15.0/15.0
- 1% rule +10.0/10.0
- DSCR +10.0/10.0
- Schools +4.1/10.0
- Livability +3.9/5.0
- Condition / age +2.5/5.0
- Rent growth +2.4/5.0
- Appreciation +0.0/10.0
$130,000
🖨 Deal sheet 📄 Offer letter ✓ Due diligence
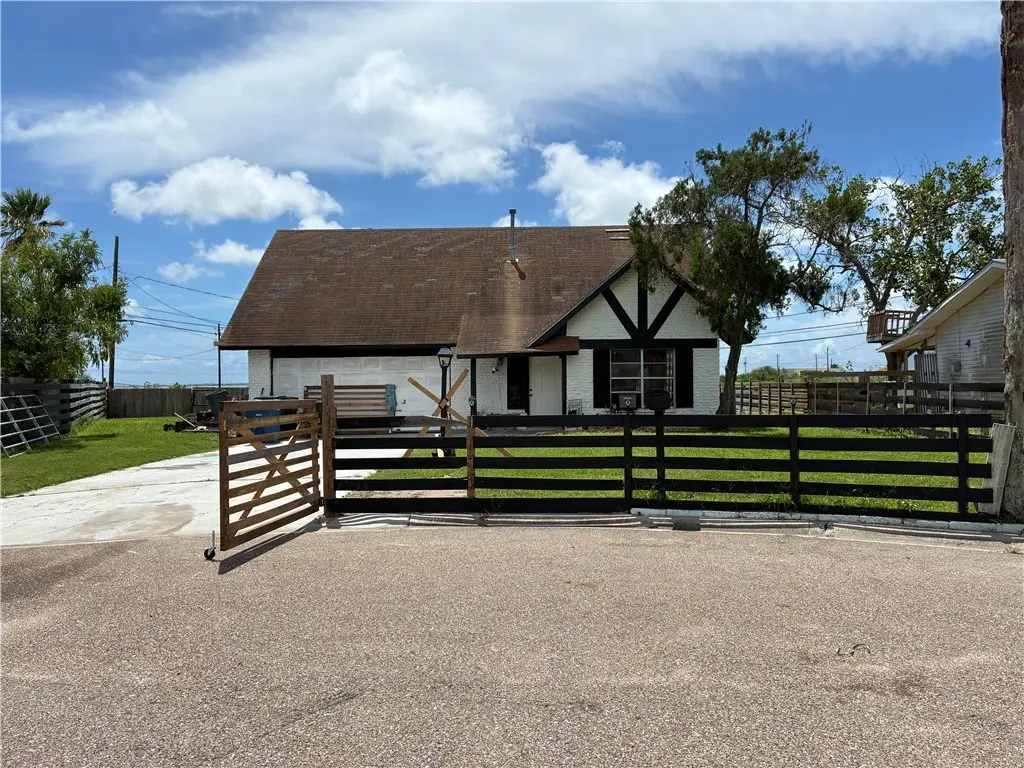
Listing remarks
Rare opportunity to own a property with stunning views of the Laguna Madre on a generous lot in a highly desirable coastal setting. This home is in significant disrepair and will require renovation, but offers an exceptional chance to create something truly special. The existing structure is a full fixer-upper and is best suited for an experienced investor, builder, or visionary buyer ready to take on a project. The value here is in the land, location, and water view. This is the perfect opportunity to enjoy peaceful surroundings, coastal breezes, and beautiful sunset views over the water. With the right improvements, this property could be transferred into a dream retreat or investment hol
Key facts
- Generous lot
- Water view
- 8,503 sq ft lot
Tags
Property features AI
Exterior
- Parking: Detached or attached garage not specified; 2-car garage; 2 covered parking spaces
- Utilities: Public water; Public sewer; Utilities available
- Home design: Two-story home; Brick and wood siding exterior; Shingle roof; Slab foundation
- Construction: Built with brick and wood siding
- Exterior features: Wood fencing; Property has a view
Interior
- Kitchen: Gas oven; Gas range
- Flooring: Unfinished flooring
- Bathrooms: One full bathroom; One half bathroom
- Interior features: No notable interior features listed
Neighborhood map
What this means for you Summary
Snapshot
- This is a 3-bed/1.5-bath single-family listed at $130k.
Deal economics
- At list price, monthly cash flow is $213 ($3k/yr) — positive.
- The deal already cash-flows at list — no discount required.
- Meets the 1% rule at list price ($2k rent vs $130k).
- Cap rate 12.2% vs local median 3.6% in Corpus Christi — top-decile yield for the area; either an underpriced asset or a hidden risk that comps aren't pricing in. Stress-test before assuming the spread holds.
Location & tenants
- Location reads 78/100 on livability (#66 in TX, #2,404 nationally) — a middle-class / working-renter tenant base. Strengths: commute A+, cost of living A+, housing A+; Watch: crime F.
- Flour Bluff ISD (urban): math 43% / reading 51% proficiency, ranked #209 of 826 in TX (top 25%) — families likely to look elsewhere, expect single-tenant / working-renter base with shorter leases.
- Market conditions: Rents soft (-0.6%/yr); 685 active listings in the ZIP; 6 comparable units currently listed for rent nearby; rentals lingering (median 44d on market — plan ~5-8 weeks vacancy on turnover, expect pricing pressure); 50% of comp listings sitting > 30 days — soft ceiling on asking rent; solid renter incomes; 1,397 units permitted in Nueces County in 2024 (47 in 5+ unit buildings).
Forward outlook
- Local home prices are declining (-3.0%/yr); year-one equity from $899 of loan paydown is wiped out by about $4k of value loss. Plan a longer hold.
- Nueces County population projected at +36% by 2050 — long-run rental-demand tailwind backs the buy-and-hold thesis.
Negotiation context
- Only 12 days on market — expect competitive offers; lowballing is unlikely to land.
- Current owner paid $14k; list at $130k implies a 803% gain — meaningful room to come down on a strong offer.
Risks & watch-outs
- Watch-outs: flood insurance adds $427/mo.
- Climate carrying-cost: in FEMA flood zone AE (mandatory federal flood insurance); severe wind risk, 99% chance of damaging wind over 30y; extreme-heat days projected 7→28/yr by 2055 (HVAC capex compounding) — expect insurance premiums to compound above CPI over the hold.
Questions for the listing agent
- Built in 1964 — when were the roof, HVAC, electrical panel, plumbing, and water heater last replaced?
- What's the actual annual flood-insurance premium (NFIP or private), and is the property in a SFHA with mandatory coverage?
- Is there a deadline driving the sale (1031 exchange, divorce, estate, relocation)? That informs how much negotiation room exists.
- Crime grade is F in this area — have there been break-ins, vandalism, or insurance claims at this property in the last 3 years? What carrier currently insures it and at what premium?
- What's the average days-on-market for RENTAL listings here right now (not sales)? A rising rental-DOM trend means longer vacancies and softer asking-rent achievability than the comps imply.
- What's the recent tenant-quality profile in this submarket — average credit score on applications, eviction rate, late-payment / NSF rate, and stable-employment percentage? A property-management company in the area should have these aggregated.
- How much new for-sale + rental construction is in the pipeline within 1–3 miles? Heavy new supply typically softens prices + rents 12–24 months out; constrained supply supports both.
Investment metrics
- 1% rule
- 1.57% ✓
- Cap rate
- 12.20%
- Cash-on-cash
- 21.09%
- DSCR
- 1.94
- GRM
- 5.3
CMA / ARV
- ARV (on-the-fly)
- $193,550
- Comps found
- 12
Show comp detail 12 sales within ~0.75 mi
| Address | Dist | Beds/Ba | Sqft | Sold | Price | $/sf | Match |
|---|---|---|---|---|---|---|---|
| 225 Hialeah Dr | 0.13mi | 3/1.5 | 1,064 (-4%) | 1mo | $179,450 | $169 | 87 |
| 428 Trinidad Dr | 0.39mi | 3/2.0 | 1,106 (0%) | 7mo | $198,900 | $180 | 74 |
| 3118 Nassau Dr | 0.28mi | 3/3.0 | 1,152 (+4%) | 3mo | $219,900 | $191 | 72 |
| 3023 Pimlico | 0.08mi | 3/1.0 | 960 (-13%) | 1mo | $165,000 | $172 | 72 |
| 2806 Ransom Island Dr | 0.33mi | 2/1.0 (-1) | 1,146 (+4%) | 8mo | $180,000 | $157 | 65 |
| 2838 Ransom Island Dr | 0.30mi | 2/2.0 (-1) | 1,189 (+8%) | 6mo | $200,000 | $168 | 61 |
| 325 Gulf Stream Dr | 0.15mi | 3/2.0 | 1,254 (+13%) | 11mo | $224,999 | $179 | 60 |
| 3310 Charlotte Dr | 0.61mi | 3/2.0 | 1,182 (+7%) | 12mo | $214,900 | $182 | 48 |
| 3309 Cartagena Dr | 0.61mi | 3/2.0 | 1,259 (+14%) | 3mo | $220,000 | $175 | 44 |
| 438 Polaris Pl | 0.62mi | 3/2.0 | 1,214 (+10%) | 11mo | $170,000 | $140 | 43 |
| 430 Antares Dr | 0.65mi | 4/2.0 (+1) | 1,233 (+12%) | 3mo | $189,900 | $154 | 41 |
| 3409 Laguna Shores Rd | 0.60mi | 2/2.0 (-1) | 1,233 (+12%) | 7mo | $395,000 | $320 | 40 |
Match score weights: distance 35% · size 25% · config 20% · recency 20%. Top-matched comps best support the ARV.
Projected returns pro-forma
-3.0% appreciation · 0.0% rent growth · sell at horizon
- IRR
- -10.3%
- Equity multiple
- 0.64×
- Total profit
- $-13,135
- Equity at exit
- $19,383
- IRR
- -8.7%
- Equity multiple
- 0.57×
- Total profit
- $-15,731
- Equity at exit
- $11,240
Cash invested: $36,400 (down + closing). Projections, not guarantees.
Landlord ↔ Tenant lean methodology
- Overall (STATE)
- 87 Strongly Landlord-Friendly
- State Texas
- 87 Strongly Landlord-Friendly · R+5
- County
- — inherits STATE
- City
- — inherits STATE
ZIP-level market 78418
- Rents YoY
- -0.6%
- Active inventory
- 685
- Price-to-rent
- 5.3×
Monthly cashflow live
- Estimated rent
- $2,046 high interval (Pro) →
- Mortgage (P&I)
- −$682
- Tax from tax record
- −$240 /mo · $2,885/yr
- Insurance
- −$54
- Flood insurance flood zone
- −$427 /mo · $5,118/yr
- HOA
- −$0
- Vacancy / Maint / Mgmt
- −$430
- Net cashflow
- $213
Break-even live
UW: 25.0% down · 7.5% · 30yr · 1.5% tax · 5.0% vac · 8.0% maint · 8.0% mgmt
Financing live
Cash to close
- Down payment
- $32,500
- Closing costs
- $3,900
- Reserves months
- —
- Total cash needed
- —
Loan-product check · same deal, 3 products live
Conventional
25% down · 7.5% · 30yr
- Down + closing
- —
- Monthly P&I
- —
- Monthly cashflow
- —
- DSCR
- —
- Eligible?
- —
Personal DTI + credit; lowest rate.
DSCR
20% down · 8.5% · 30yr
- Down + closing
- —
- Monthly P&I
- —
- Monthly cashflow
- —
- DSCR
- —
- Eligible?
- —
No personal income docs; deal must DSCR.
Hard money
10% down · 12.0% · 12mo
- Down + closing
- —
- Monthly P&I
- —
- Monthly cashflow
- —
- DSCR
- —
- Eligible?
- —
Short-term bridge; refi at stabilization.
Rent comps 6 comps
| Address | Beds | Baths | Sqft | Rent | $/sqft | DOM | Units | Dist |
|---|---|---|---|---|---|---|---|---|
| 3021 Laguna Shores Rd Corpus Christi, TX | 2.0 | 2.0 | 1440 | $2,500 | $1.74 | 43d | 1 | 0.24mi |
| 530 Oakdale Dr Corpus Christi, TX | 2.0 | 1.0 | 1113 | $1,350 | $1.21 | 43d | 1 | 0.58mi |
| 2725 Waldron Rd Apt 14 Corpus Christi, TX | 2.0 | 1.0 | 850 | $925 | $1.09 | 43d | 1 | 0.61mi |
| 2725 Waldron Rd Apt 24 Corpus Christi, TX | 2.0 | 1.0 | 850 | $985 | $1.16 | 13d | 1 | 0.61mi |
| 3942 Laguna Shores Rd Corpus Christi, TX | 3.0 | 2.0 | 1500 | $3,800 | $2.53 | 13d | 1 | 1.29mi |
| 557 Yorktown Blvd Corpus Christi, TX | 3.0–5.0 | 2.0 | 1714 | $2,337 | $1.36 | 13d | 1 | 1.34mi |
Listing history 11 events
-
2026-06-18days on market $130,000 Active 12 DOM
-
2026-06-17days on market $130,000 Active 11 DOM
-
2026-06-16days on market $130,000 Active 10 DOM
-
2026-06-15days on market $130,000 Active 9 DOM
-
2026-06-14days on market $130,000 Active 7 DOM
-
2026-06-13days on market $130,000 Active 6 DOM
-
2026-06-10days on market $130,000 Active 4 DOM
-
2026-06-09days on market $130,000 Active 3 DOM
-
2026-06-08days on market $130,000 Active 2 DOM
-
2026-06-07remarks 699-char remark
-
2026-06-07$130,000 Active 1 DOM
ⓘ Source: listings_history table (triggers on properties + properties_extension) + one-shot
backfill from property_details.listing_events for pre-trigger history.
Tax reassessment forecast TX · Resets to sale price
- Current annual tax
- $2,885 · $240/mo
- Projected year-2 tax
- $2,885 · $240/mo
- Expected delta
- $0/yr ($0/mo · 0.0%)
ⓘ Screening estimate from a state-policy table — verify with the county assessor before closing.
Climate risk First Street
- Flood 9/10 Extreme FEMA zone AE · 99% chance over 30 yrs
- Wildfire 3/10 Moderate
- Heat 10/10 Extreme 7 d/yr ≥108°F today · 28 d/yr by 30 yrs out
- Wind 9/10 Extreme 99% chance of damaging wind over 30 yrs
- Air quality 1/10 Low 0 unhealthy d/yr today · 0 by 30 yrs out
Nearby sold comps map
Loading sold comps map…
Walkable amenities ~0.75 mi
Loading nearby amenities…
Taxation est. · year 1
- Rental income
- $24,549
- − Mortgage interest
- −$7,282
- − Property taxes
- −$2,885
- − Insurance
- −$5,768
- − Repairs & maintenance
- −$1,964
- − Management
- −$1,964
- − Depreciation
- −$3,782
- Taxable income
- $904
- Est. tax owed @ 24.0%
- −$217
- After-tax cash flow
- $2,343/yr
For passive investors: Depreciation is non-cash, so a rental often shows a tax loss while cash-flowing — sheltering income. Rental losses are passive: they offset passive income freely, and up to $25,000/yr can offset ordinary (W-2) income if you actively participate and your MAGI is under $100k (phasing out to $0 by $150k); unused losses carry forward. On sale, claimed depreciation is recaptured at up to 25%, and gains may owe capital-gains tax (a 1031 exchange can defer both). Figures are a year-1 estimate at your 24.0% rate — not tax advice; consult a CPA.
Schools (NCES district)
- District
- Flour Bluff ISD
- NCES district ID
- 4819380
- Math proficiency
- 43% ▼ -12.00%
- Reading proficiency
- 51% ▼ -2.00%
- Median HH income
- $57,162
- Composite
- 40.96/100
- National rank
- #3604
- State rank
- #209 of 826 in TX
Livability — Corpus Christi
- Score
- 78/100
- State rank
- #66
- US rank
- #2404
Category grades
Schools grade is shown separately in the Schools card above.
Census & demographics
- Census place
- Corpus Christi, TX
- County
- Nueces County · 296,836 people
- City population
- 296,836
- Metro
- Corpus Christi, TX
- Population (ZIP)
- 29,790
- Household income
- $92,445
- Rent vs Own
- Severe rent burden
- 808.0
Population outlook (Nueces County) Hauer SSP2
- Today (2025)
- 418,037 people
- By 2030
- 447,123 · +7.0%
- By 2040
- 505,911 · +21.0%
- By 2050
- 567,522 · +35.8%
- By 2075
- 729,686 · +74.6%
- By 2100
- 847,087 · +102.6%
Race, ethnicity, and origin ACS 2023
- Neighborhood character
- Majority White (61%)
- Race & ethnicity
- White 61% Hispanic / Latino 29% Two or more races 19% Asian 3% Black 3%
- Hispanic origin (detail)
- Mexican 25%
- Common ancestry
- Romanian 2% Lithuanian 2% Slovak 2%
- Foreign-born
- 7% · Canada, China
- Languages at home
- 83% English-only · Spanish 14% Tagalog/Filipino 2%
Political lean MEDSL · Nueces
- 2024 margin
- R (+11.5) · D 43.8% · R 55.3%
- 2008→2024 swing
- -7.1pp toward R · 2008: -4.4pp · 2024: -11.5pp
- All cycles
- 2024: R+11.5 2020: R+2.9 2016: R+1.5 2012: R+3.2 2008: R+4.4
Not yet ingested
- Civics
- —
Market trends
- HPI YoY
- ▼ -168.81%
- Current HPI
- 193.902
- Rent YoY
- ▼ -0.57%
- Metro
- Corpus Christi, TX
- State GDP YoY
- ▲ 3.95%
- F500 in state
- 110
Industry mix (Fortune 500 HQ in TX)
| Industry | F500 HQs | Revenue |
|---|---|---|
| Energy | 16 | $1,198B |
|
||
| Technology | 5 | $198B |
|
||
| Engineering / Construction | 4 | $72B |
|
||
| Energy Services | 3 | $60B |
|
||
| Utilities | 3 | $41B |
|
||
| Healthcare | 2 | $330B |
|
||
Price history
+802.8% since first listed2 events — show timeline
- 2026-06-06 Listed $130,000 CBMLS
- 1997-07-09 Sold (Public Records) $14,400 Public Records
Property tax history
+4.1%/yrLatest (2025): $2,885 · +12.9% YoY. Source: county tax records.
Cash-flow waterfall
monthlySold comps — $/sqft
last 12 mo · ≤1 miLoading sold comps…