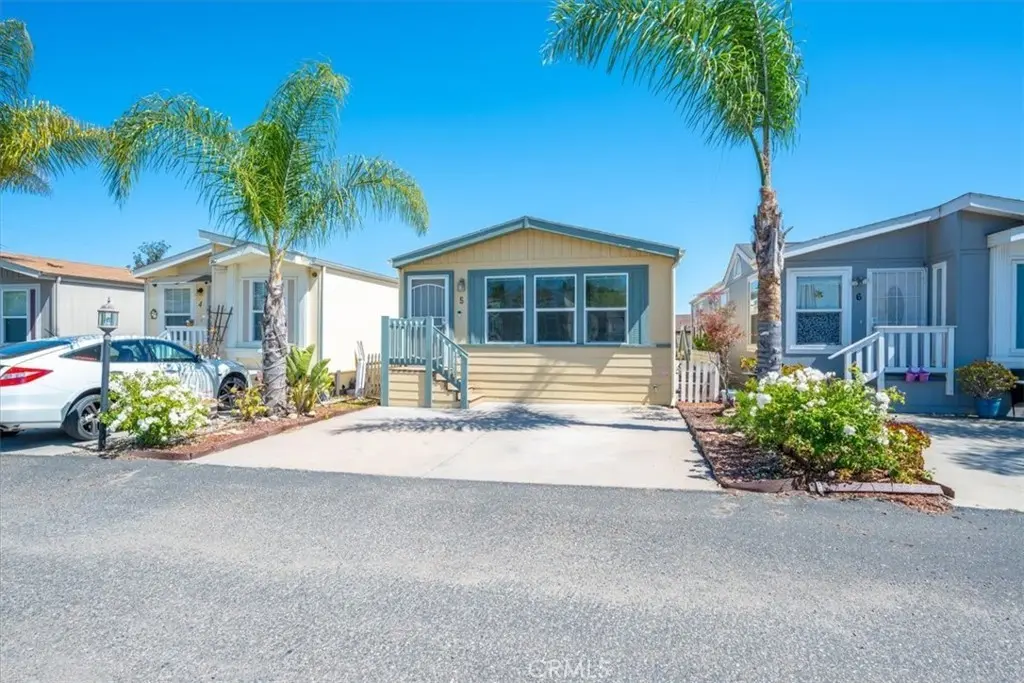
449 W Teft St #5
Nipomo, CA 93444
$225,000B-
2 bd · 2.0 ba ·
960 sqft ·
Built 2013
· Manufactured
· Active
· 7 DOM
Cashflow @ list (25.0% down · 7.5%)
Estimated rent
$2,632/mo
Mortgage (P&I)
−$1,180
Tax + insurance
−$150
HOA
−$0
Vac / Maint / Mgmt
−$553
Net cashflow
$750/mo
Annual
$8,997/yr
Cap rate
10.29%
Cash-on-cash
14.28%
DSCR
1.64
1% rule
1.17%
Cash to close
$63,000
Investor read
- This is a 2-bed/2.0-bath manufactured listed at $225k.
- At list price, monthly cash flow is $750 ($9k/yr) — positive.
- The deal already cash-flows at list — no discount required.
- Meets the 1% rule at list price ($3k rent vs $225k).
- Only 7 days on market — expect competitive offers; lowballing is unlikely to land.
- Local home prices are declining (-3.0%/yr); year-one equity from $2k of loan paydown is wiped out by about $7k of value loss. Plan a longer hold.
- Location reads 61/100 on livability (#526 in CA) — a middle-class / working-renter tenant base. Strengths: employment A+, health & safety A-, housing B; Watch: crime C-, schools D+, amenities F.
- Lucia Mar Unified (town): math 42% / reading 56% proficiency, ranked #433 of 1,400 in CA (top 31%) — families likely to look elsewhere, expect single-tenant / working-renter base with shorter leases.
- Market conditions: 77 active listings in the ZIP; 6 comparable units currently listed for rent nearby; rentals lingering (median 44d on market — plan ~5-8 weeks vacancy on turnover, expect pricing pressure); 50% of comp listings sitting > 30 days — soft ceiling on asking rent; 1,104 units permitted in San Luis Obispo County in 2024 (273 in 5+ unit buildings).
- San Luis Obispo County population projected at +20% by 2050 — long-run rental-demand tailwind backs the buy-and-hold thesis.
- 4 sale attempts since 10y ago with the ask held roughly flat each time — persistent listings suggest the price (not the market) is what's stuck; bring a comps-based counter.
- Current owner paid $145k; list at $225k implies a 55% gain — meaningful room to come down on a strong offer.
- At projected returns (-3.0% appreciation + 3.0% rent growth), your $63k cash investment doubles in ~9 years — after that, you're playing with house money.
- Climate carrying-cost: major wildfire risk — expect insurance premiums to compound above CPI over the hold.
- Cap rate 10.3% vs local median 2.3% in Nipomo — top-decile yield for the area; either an underpriced asset or a hidden risk that comps aren't pricing in. Stress-test before assuming the spread holds.
Questions for listing agent
- Is there a deadline driving the sale (1031 exchange, divorce, estate, relocation)? That informs how much negotiation room exists.
- Schools are D-rated, which usually means shorter tenancies and higher turnover. Who's the typical renter profile here, and what's been the actual vacancy rate?
- What's the average days-on-market for RENTAL listings here right now (not sales)? A rising rental-DOM trend means longer vacancies and softer asking-rent achievability than the comps imply.
- What's the recent tenant-quality profile in this submarket — average credit score on applications, eviction rate, late-payment / NSF rate, and stable-employment percentage? A property-management company in the area should have these aggregated.
- How much new for-sale + rental construction is in the pipeline within 1–3 miles? Heavy new supply typically softens prices + rents 12–24 months out; constrained supply supports both.
CashFlowRE · CFR-H34S2F56W7MMG9
· Data 2 days ago
cashflowre.app · 2026-05-29