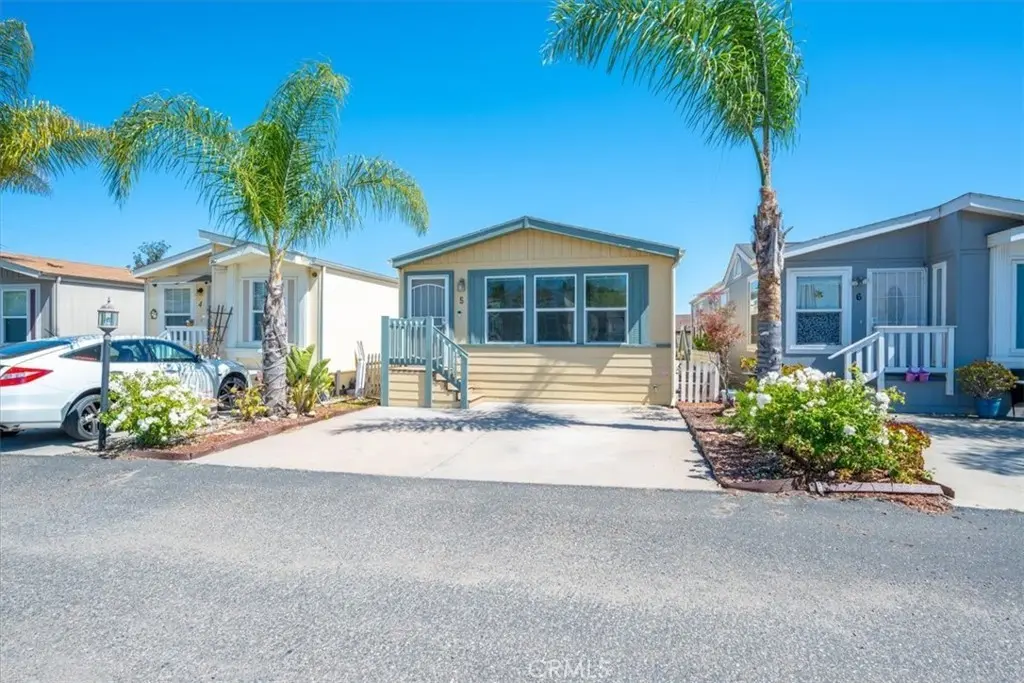
449 W Teft St #5 · Nipomo, CA
Flood risk 1/10 · Minimal
- FEMA flood zone
- X (unshaded)
- Chance of flooding over 30 yrs
- 0.0%
- Est. flood insurance / yr
- $507 – $1,088
Fire risk 6/10 · Moderate
- Est. fire insurance / yr
- $659 – $1,223
Heat risk 4/10 · Minor
- Hot days now (above 84°F)
- 7 days/yr
- Hot days in 30 yrs
- 16 days/yr
Wind risk 1/10 · Minimal
- Chance of severe wind over 30 yrs
- —
Air-quality risk 5/10 · Moderate
- Unhealthy air days now
- 8 days/yr
- Unhealthy air days in 30 yrs
- 8 days/yr
Risk factors via First Street. Map © Google.
Why this score? — see what drove the B- grade
The composite is a weighted blend of 9 inputs, each scored 0–100. Each bar is that input's sub-score; the figure is the points it added to the 100-point composite (weight × sub-score).
- Cash flow +28.7/30.0
- DSCR +10.0/10.0
- ARV discount +8.2/15.0
- 1% rule +6.7/10.0
- Schools +4.5/10.0
- Livability +3.1/5.0
- Rent growth +2.5/5.0
- Condition / age +2.5/5.0
- Appreciation +0.0/10.0
$225,000
🖨 Deal sheet 📄 Offer letter ✓ Due diligence
Listing remarks MLS
Looking for an affordable tiny home on the California Central Coast? Look no further! Newer property in an all aged manufactured home community with a space rent currently as low as $350. Close to shopping and HWY 101. You will absolutely love this charming home the minute you walk in! This well taken care of home has 2 Bedrooms, 2 Full Baths. Airy feeling living room with dining area and breakfast bar. Natural lighting & open kitchen area with plentiful storage. This is the perfect place if you are searching for affordable living on the central coast!
Key facts
- Built 2013
- Listed 7 days
Property features AI
Finance
- Other: Living area source: Seller
- HOA & community: Land lease: $995; Park community: Urban
Exterior
- Parking: Located in Buena Vista MHP (mobile home park)
- Utilities: Public sewer; District/Public water
- Home design: Single-story mobile home (Double-wide model: GoldenPacific); Entry level: 1; Mobile home remains on site
- Construction: Approximately 20 ft wide by 48 ft long; Year built source: Other
- Exterior features: No pool; No landscaping
Interior
- Bathrooms: 2 full bathrooms
- Interior features: Front door entry
- Laundry & utility: Laundry area
Neighborhood map
What this means for you Summary
Snapshot
- This is a 2-bed/2.0-bath manufactured listed at $225k.
Deal economics
- At list price, monthly cash flow is $750 ($9k/yr) — positive.
- The deal already cash-flows at list — no discount required.
- Meets the 1% rule at list price ($3k rent vs $225k).
- Cap rate 10.3% vs local median 2.3% in Nipomo — top-decile yield for the area; either an underpriced asset or a hidden risk that comps aren't pricing in. Stress-test before assuming the spread holds.
Location & tenants
- Location reads 61/100 on livability (#526 in CA) — a middle-class / working-renter tenant base. Strengths: employment A+, health & safety A-, housing B; Watch: crime C-, schools D+, amenities F.
- Lucia Mar Unified (town): math 42% / reading 56% proficiency, ranked #433 of 1,400 in CA (top 31%) — families likely to look elsewhere, expect single-tenant / working-renter base with shorter leases.
- Market conditions: 77 active listings in the ZIP; 6 comparable units currently listed for rent nearby; rentals lingering (median 44d on market — plan ~5-8 weeks vacancy on turnover, expect pricing pressure); 50% of comp listings sitting > 30 days — soft ceiling on asking rent; 1,104 units permitted in San Luis Obispo County in 2024 (273 in 5+ unit buildings).
Forward outlook
- Local home prices are declining (-3.0%/yr); year-one equity from $2k of loan paydown is wiped out by about $7k of value loss. Plan a longer hold.
- San Luis Obispo County population projected at +20% by 2050 — long-run rental-demand tailwind backs the buy-and-hold thesis.
- At projected returns (-3.0% appreciation + 3.0% rent growth), your $63k cash investment doubles in ~9 years — after that, you're playing with house money.
Negotiation context
- Only 7 days on market — expect competitive offers; lowballing is unlikely to land.
- 4 sale attempts since 10y ago with the ask held roughly flat each time — persistent listings suggest the price (not the market) is what's stuck; bring a comps-based counter.
- Current owner paid $145k; list at $225k implies a 55% gain — meaningful room to come down on a strong offer.
Risks & watch-outs
- Climate carrying-cost: major wildfire risk — expect insurance premiums to compound above CPI over the hold.
Questions for the listing agent
- Is there a deadline driving the sale (1031 exchange, divorce, estate, relocation)? That informs how much negotiation room exists.
- Schools are D-rated, which usually means shorter tenancies and higher turnover. Who's the typical renter profile here, and what's been the actual vacancy rate?
- What's the average days-on-market for RENTAL listings here right now (not sales)? A rising rental-DOM trend means longer vacancies and softer asking-rent achievability than the comps imply.
- What's the recent tenant-quality profile in this submarket — average credit score on applications, eviction rate, late-payment / NSF rate, and stable-employment percentage? A property-management company in the area should have these aggregated.
- How much new for-sale + rental construction is in the pipeline within 1–3 miles? Heavy new supply typically softens prices + rents 12–24 months out; constrained supply supports both.
Investment metrics
- 1% rule
- 1.17% ✓
- Cap rate
- 10.29%
- Cash-on-cash
- 14.28%
- DSCR
- 1.64
- GRM
- 7.1
CMA / ARV
- ARV (on-the-fly)
- $228,480
- Comps found
- 5
Show comp detail 5 sales within ~0.75 mi
| Address | Dist | Beds/Ba | Sqft | Sold | Price | $/sf | Match |
|---|---|---|---|---|---|---|---|
| 449 W Tefft St #7 | 0.00mi | 2/2.0 | 944 (-2%) | 1mo | $225,000 | $238 | 96 |
| 449 W TEFFT #34 | 0.00mi | 2/2.0 | 960 (0%) | 8mo | $190,000 | $198 | 94 |
| 449 W Tefft #13 | 0.00mi | 2/2.0 | 864 (-10%) | 1mo | $225,000 | $260 | 82 |
| 449 W Tefft St #23 | 0.00mi | 2/2.0 | 859 (-10%) | 3mo | $186,000 | $217 | 80 |
| 449 W Tefft #22 | 0.00mi | 2/2.0 | 834 (-13%) | 2mo | $225,000 | $270 | 76 |
Match score weights: distance 35% · size 25% · config 20% · recency 20%. Top-matched comps best support the ARV.
Projected returns pro-forma
-3.0% appreciation · 3.0% rent growth · sell at horizon
- IRR
- 4.6%
- Equity multiple
- 1.18×
- Total profit
- $11,196
- Equity at exit
- $33,548
- IRR
- 14.0%
- Equity multiple
- 2.12×
- Total profit
- $70,840
- Equity at exit
- $19,454
Cash invested: $63,000 (down + closing). Projections, not guarantees.
Landlord ↔ Tenant lean methodology
- Overall (STATE)
- 18 Strongly Tenant-Friendly
- State California
- 18 Strongly Tenant-Friendly · D+13
- County
- — inherits STATE
- City
- — inherits STATE
ZIP-level market 93444
- Home prices YoY
- -34.0%
- Active inventory
- 77
- Price-to-rent
- 7.1×
Monthly cashflow live
- Estimated rent
- $2,632 high interval (Pro) →
- Mortgage (P&I)
- −$1,180
- Tax from tax record
- −$56 /mo · $673/yr
- Insurance
- −$94
- HOA
- −$0
- Vacancy / Maint / Mgmt
- −$553
- Net cashflow
- $750
Break-even live
UW: 25.0% down · 7.5% · 30yr · 1.5% tax · 5.0% vac · 8.0% maint · 8.0% mgmt
Financing live
Cash to close
- Down payment
- $56,250
- Closing costs
- $6,750
- Reserves months
- —
- Total cash needed
- —
Loan-product check · same deal, 3 products live
Conventional
25% down · 7.5% · 30yr
- Down + closing
- —
- Monthly P&I
- —
- Monthly cashflow
- —
- DSCR
- —
- Eligible?
- —
Personal DTI + credit; lowest rate.
DSCR
20% down · 8.5% · 30yr
- Down + closing
- —
- Monthly P&I
- —
- Monthly cashflow
- —
- DSCR
- —
- Eligible?
- —
No personal income docs; deal must DSCR.
Hard money
10% down · 12.0% · 12mo
- Down + closing
- —
- Monthly P&I
- —
- Monthly cashflow
- —
- DSCR
- —
- Eligible?
- —
Short-term bridge; refi at stabilization.
Rent comps 6 comps
| Address | Beds | Baths | Sqft | Rent | $/sqft | DOM | Units | Dist |
|---|---|---|---|---|---|---|---|---|
| 325 Sunnyslope Ln Nipomo, CA | 2.0 | 2.0 | 1033 | $2,900 | $2.81 | 43d | 1 | 0.21mi |
| 206 W Price St Nipomo, CA | 2.0 | 2.0 | 721 | $2,395 | $3.32 | 43d | 1 | 0.40mi |
| 172 W Price St Unit 2 Nipomo, CA | 2.0 | 2.0 | 1000 | $2,200 | $2.20 | 23d | 1 | 0.45mi |
| 516 Adina Way Nipomo, CA | 2.0 | 1.5 | 964 | $2,650 | $2.75 | 43d | 1 | 0.60mi |
| 183 E Dana St Nipomo, CA | 3.0 | 1.0 | 1020 | $3,000 | $2.94 | 23d | 1 | 0.75mi |
| 509 Robert Ct Unit A Nipomo, CA | 2.0 | 1.0 | 750 | $2,300 | $3.07 | 23d | 1 | 0.91mi |
Listing history 7 events
-
2026-06-18days on market $225,000 Active 7 DOM
-
2026-06-17days on market $225,000 Active 6 DOM
-
2026-06-16days on market $225,000 Active 5 DOM
-
2026-06-15days on market $225,000 Active 4 DOM
-
2026-06-14days on market $225,000 Active 2 DOM
-
2026-06-13remarks 648-char remark
-
2026-06-13$225,000 Active 1 DOM
ⓘ Source: listings_history table (triggers on properties + properties_extension) + one-shot
backfill from property_details.listing_events for pre-trigger history.
Tax reassessment forecast CA · Resets to sale price
- Current annual tax
- $673 · $56/mo
- Projected year-2 tax
- $1,710 · $142/mo
- Expected delta
- +$1,037/yr (+$86/mo · 154.2%)
ⓘ Screening estimate from a state-policy table — verify with the county assessor before closing.
Climate risk First Street
- Flood 1/10 Low FEMA zone X (unshaded) · 0% chance over 30 yrs
- Wildfire 6/10 Major
- Heat 4/10 Moderate 7 d/yr ≥84°F today · 16 d/yr by 30 yrs out
- Wind 1/10 Low
- Air quality 5/10 Major 8 unhealthy d/yr today · 8 by 30 yrs out
Nearby sold comps map
Loading sold comps map…
Walkable amenities ~0.75 mi
Loading nearby amenities…
Taxation est. · year 1
- Rental income
- $31,588
- − Mortgage interest
- −$12,603
- − Property taxes
- −$673
- − Insurance
- −$1,125
- − Repairs & maintenance
- −$2,527
- − Management
- −$2,527
- − Depreciation
- −$6,545
- Taxable income
- $5,587
- Est. tax owed @ 24.0%
- −$1,341
- After-tax cash flow
- $7,657/yr
For passive investors: Depreciation is non-cash, so a rental often shows a tax loss while cash-flowing — sheltering income. Rental losses are passive: they offset passive income freely, and up to $25,000/yr can offset ordinary (W-2) income if you actively participate and your MAGI is under $100k (phasing out to $0 by $150k); unused losses carry forward. On sale, claimed depreciation is recaptured at up to 25%, and gains may owe capital-gains tax (a 1031 exchange can defer both). Figures are a year-1 estimate at your 24.0% rate — not tax advice; consult a CPA.
Schools (NCES district)
- District
- Lucia Mar Unified
- NCES district ID
- 0623080
- Math proficiency
- 42% ▲ 3.00%
- Reading proficiency
- 56% ▲ 2.00%
- Median HH income
- $62,681
- Composite
- 45.19/100
- National rank
- #5782
- State rank
- #433 of 1400 in CA
Livability — Nipomo
- Score
- 61/100
- State rank
- #526
- US rank
- #17699
Category grades
Schools grade is shown separately in the Schools card above.
Census & demographics
- Census place
- Nipomo, CA
- City population
- 21,495
- Population (ZIP)
- 21,495
Population outlook (San Luis Obispo County) Hauer SSP2
- Today (2025)
- 306,977 people
- By 2030
- 320,378 · +4.4%
- By 2040
- 343,933 · +12.0%
- By 2050
- 366,853 · +19.5%
- By 2075
- 428,329 · +39.5%
- By 2100
- 460,687 · +50.1%
Race, ethnicity, and origin ACS 2023
- Neighborhood character
- Diverse neighborhood (Simpson 0.57)
- Race & ethnicity
- White 48% Hispanic / Latino 44% Two or more races 23% Asian 3% Native American 2% Black 1%
- Hispanic origin (detail)
- Mexican 40% Puerto Rican 2%
- Common ancestry
- Lithuanian 3% Russian 2% Slovak 2%
- Foreign-born
- 14% · Canada, South Korea
- Languages at home
- 74% English-only · Spanish 23% Tagalog/Filipino 1% Chinese 1%
Political lean MEDSL · San Luis Obispo
- 2024 margin
- D (+10.9) · D 53.9% · R 43.1% · Other 3.0%
- 2008→2024 swing
- +5.5pp toward D · 2008: 5.4pp · 2024: 10.9pp
- All cycles
- 2024: D+10.9 2020: D+13.1 2016: D+8.3 2012: D+1.0 2008: D+5.4
Not yet ingested
- Civics
- —
Market trends
- HPI YoY
- ▼ -188.36%
- Current HPI
- 366.0133
- Rent YoY
- —
- Metro
- —
- State GDP YoY
- ▲ 3.21%
- F500 in state
- 116
Industry mix (Fortune 500 HQ in CA)
| Industry | F500 HQs | Revenue |
|---|---|---|
| Technology | 27 | $1,492B |
|
||
| Financial Services | 3 | $174B |
|
||
| Retail | 3 | $44B |
|
||
| Insurance | 3 | $26B |
|
||
| Media / Entertainment | 2 | $115B |
|
||
| Pharmaceuticals / Biotech | 2 | $62B |
|
||
Price history
+95.7% since first listed9 events — show timeline
- 2026-06-11 Listed $225,000 CRMLS
- 2019-09-06 Sold (MLS) $145,000 NSBCRMLS
- 2019-07-29 Pending — NSBCRMLS
- 2019-07-16 Contingent — NSBCRMLS
- 2019-07-12 Listed $145,000 NSBCRMLS
- 2017-04-13 Listing Removed — CRMLS
- 2017-04-04 Listing Removed — NSBCRMLS
- 2017-03-16 Listed $115,000 CRMLS
- 2016-05-10 Listed $115,000 NSBCRMLS
Property tax history
+1.6%/yrLatest (2025): $673 · +3.7% YoY. Source: county tax records.
Cash-flow waterfall
monthlySold comps — $/sqft
last 12 mo · ≤1 miLoading sold comps…