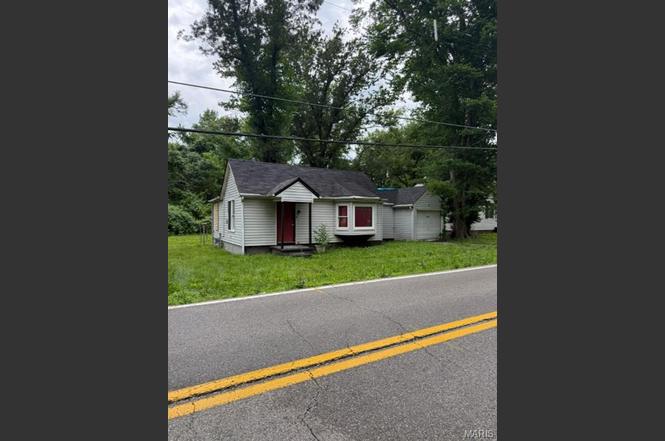
10105 Imperial Dr
Dellwood, MO 63136
$22,500B
1 bd · 1.0 ba ·
702 sqft ·
Built 1956
· SingleFamily
· Active
· 5 DOM
Cashflow @ list (25.0% down · 7.5%)
Estimated rent
$868/mo
Mortgage (P&I)
−$118
Tax + insurance
−$487
HOA
−$0
Vac / Maint / Mgmt
−$182
Net cashflow
$81/mo
Annual
$971/yr
Cap rate
33.36%
Cash-on-cash
96.66%
DSCR
5.30
1% rule
3.86%
Cash to close
$6,300
Investor read
- This is a 1-bed/1.0-bath single-family listed at $22k.
- At list price, monthly cash flow is $81 ($971/yr) — positive.
- The deal already cash-flows at list — no discount required.
- Meets the 1% rule at list price ($868 rent vs $22k).
- Only 5 days on market — expect competitive offers; lowballing is unlikely to land.
- In year one you build about $1k of equity ($156 loan paydown + $853 appreciation (3.8% local appreciation)).
- Location reads 66/100 on livability (#239 in MO) — a middle-class / working-renter tenant base. Strengths: cost of living A+, housing A+; Watch: health & safety C-, crime D-, amenities F.
- Riverview Gardens (suburban): math 2% / reading 9% proficiency, ranked #324 of 324 in MO (top 100%) — low school quality limits family demand, transient renter base, plan for 1-2y turnover; 90% free/reduced lunch — lower-income household profile, screen leases tightly.
- Zoned schools: Lemasters Elem. (math 2% / reading 12%, grade F, #1,058 of 1,115 statewide, top 96%, 295 students, 99% FRL); Riverview Gardens Sr. High (math 2% / reading 18%, grade F, #501 of 521 statewide, top 97%, 1,331 students, 100% FRL).
- Watch-outs: property tax is 2.7% of price; flood insurance adds $427/mo; built in 1956 — expect roof / HVAC / electrical / plumbing capex.
- Market conditions: Rents rising fast (+5.0%/yr); 376 active listings in the ZIP; 5 comparable units currently listed for rent nearby; rentals leasing fast (median 0d on market — plan ~1-2 weeks tenant-placement turnaround); lower-income renter base — watch delinquency; 920 units permitted in St. Louis County in 2024 (250 in 5+ unit buildings).
- Current owner paid $15k; list at $22k implies a 50% gain — meaningful room to come down on a strong offer.
- At projected returns (3.8% appreciation + 5.0% rent growth), your $6k cash investment doubles in ~3 years — after that, you're playing with house money.
- Climate carrying-cost: in FEMA flood zone AE (mandatory federal flood insurance) — expect insurance premiums to compound above CPI over the hold.
- Cap rate 33.4% vs local median 10.2% in Dellwood — top-decile yield for the area; either an underpriced asset or a hidden risk that comps aren't pricing in. Stress-test before assuming the spread holds.
Questions for listing agent
- Built in 1956 — when were the roof, HVAC, electrical panel, plumbing, and water heater last replaced?
- Property tax is high relative to price — has the assessment been appealed recently, and will the sale trigger a re-assessment?
- What's the actual annual flood-insurance premium (NFIP or private), and is the property in a SFHA with mandatory coverage?
- Is there a deadline driving the sale (1031 exchange, divorce, estate, relocation)? That informs how much negotiation room exists.
- Schools are D-rated, which usually means shorter tenancies and higher turnover. Who's the typical renter profile here, and what's been the actual vacancy rate?
- Crime grade is D in this area — have there been break-ins, vandalism, or insurance claims at this property in the last 3 years? What carrier currently insures it and at what premium?
- What's the average days-on-market for RENTAL listings here right now (not sales)? A rising rental-DOM trend means longer vacancies and softer asking-rent achievability than the comps imply.
- What's the recent tenant-quality profile in this submarket — average credit score on applications, eviction rate, late-payment / NSF rate, and stable-employment percentage? A property-management company in the area should have these aggregated.
CashFlowRE · CFR-H4Q5214GHWT0G3
· Data 15 h ago
cashflowre.app · 2026-05-29