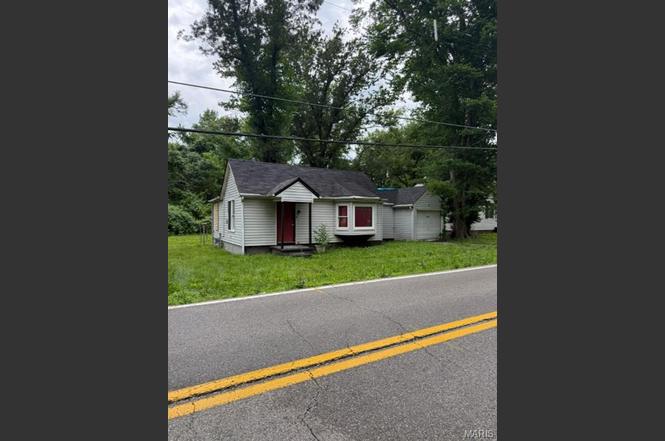
10105 Imperial Dr · Dellwood, MO
Flood risk 6/10 · Moderate
- FEMA flood zone
- AE
- Chance of flooding over 30 yrs
- 0.7%
- Est. flood insurance / yr
- $1,737 – $8,500
Fire risk 1/10 · Minimal
- Est. fire insurance / yr
- $1,054 – $1,958
Heat risk 4/10 · Minor
- Hot days now (above 106°F)
- 7 days/yr
- Hot days in 30 yrs
- 20 days/yr
Wind risk 2/10 · Minimal
- Chance of severe wind over 30 yrs
- 1.0%
Air-quality risk 3/10 · Minor
- Unhealthy air days now
- 3 days/yr
- Unhealthy air days in 30 yrs
- 5 days/yr
Risk factors via First Street. Map © Google.
Why this score? — see what drove the B grade
The composite is a weighted blend of 9 inputs, each scored 0–100. Each bar is that input's sub-score; the figure is the points it added to the 100-point composite (weight × sub-score).
- Cash flow +30.0/30.0
- 1% rule +10.0/10.0
- DSCR +10.0/10.0
- ARV discount +7.5/15.0
- Appreciation +6.9/10.0
- Rent growth +3.7/5.0
- Livability +3.3/5.0
- Condition / age +2.5/5.0
- Schools +0.4/10.0
$22,500
🖨 Deal sheet (PDF) 📄 Offer letter ✓ Due diligence
Listing remarks
Investor opportunity with strong upside potential. 2-bedroom ranch with attached garage situated on a level lot in St. Louis County. Property is being sold strictly AS-IS and requires repairs and updates. Seller will make no repairs, provide no inspections, and offer no warranties. Excellent opportunity for rehab, rental income, or value-add investment. Buyer responsible for verifying all information including condition, square footage, schools, utilities, and municipal requirements. Cash buyers preferred. Proof of funds required with all offers.
Key facts
- Garage
- Built 1956
- Listed 4 days
Property features AI
Exterior
- Parking: Attached garage (1 car)
- Utilities: Public water; Public sewer; Electricity available; Natural gas available; Electric service: Other
- Home design: Single family residence; One story
- Construction: Frame construction
- Exterior features: Level lot
Interior
- Bedrooms: 2 bedrooms on the main level
- Bathrooms: 1 full bathroom on the main level
- Heating & cooling: Forced air heating; Central air conditioning
- Interior features: Full basement
Neighborhood map
What this means for you Summary
Snapshot
- This is a 1-bed/1.0-bath single-family listed at $22k.
Deal economics
- At list price, monthly cash flow is $81 ($971/yr) — positive.
- The deal already cash-flows at list — no discount required.
- Meets the 1% rule at list price ($868 rent vs $22k).
- Cap rate 33.4% vs local median 10.4% in Dellwood — top-decile yield for the area; either an underpriced asset or a hidden risk that comps aren't pricing in. Stress-test before assuming the spread holds.
Location & tenants
- Location reads 66/100 on livability (#239 in MO) — a middle-class / working-renter tenant base. Strengths: cost of living A+, housing A+; Watch: health & safety C-, crime D-, amenities F.
- Riverview Gardens (suburban): math 2% / reading 9% proficiency, ranked #324 of 324 in MO (top 100%) — low school quality limits family demand, transient renter base, plan for 1-2y turnover; 90% free/reduced lunch — lower-income household profile, screen leases tightly.
- Zoned schools: Lemasters Elem. (math 2% / reading 12%, grade F, #1,058 of 1,115 statewide, top 96%, 295 students, 99% FRL); Riverview Gardens Sr. High (math 2% / reading 18%, grade F, #501 of 521 statewide, top 97%, 1,331 students, 100% FRL).
- Market conditions: Rents rising fast (+5.0%/yr); 376 active listings in the ZIP; 5 comparable units currently listed for rent nearby; rentals leasing fast (median 0d on market — plan ~1-2 weeks tenant-placement turnaround); lower-income renter base — watch delinquency; 920 units permitted in St. Louis County in 2024 (250 in 5+ unit buildings).
Forward outlook
- In year one you build about $1k of equity ($156 loan paydown + $853 appreciation (3.8% local appreciation)).
- At projected returns (3.8% appreciation + 5.0% rent growth), your $6k cash investment doubles in ~3 years — after that, you're playing with house money.
Negotiation context
- Only 5 days on market — expect competitive offers; lowballing is unlikely to land.
- Current owner paid $15k; list at $22k implies a 50% gain — meaningful room to come down on a strong offer.
Risks & watch-outs
- Watch-outs: property tax is 2.7% of price; flood insurance adds $427/mo; built in 1956 — expect roof / HVAC / electrical / plumbing capex.
- Climate carrying-cost: in FEMA flood zone AE (mandatory federal flood insurance) — expect insurance premiums to compound above CPI over the hold.
Questions for the listing agent
- Built in 1956 — when were the roof, HVAC, electrical panel, plumbing, and water heater last replaced?
- Property tax is high relative to price — has the assessment been appealed recently, and will the sale trigger a re-assessment?
- What's the actual annual flood-insurance premium (NFIP or private), and is the property in a SFHA with mandatory coverage?
- Is there a deadline driving the sale (1031 exchange, divorce, estate, relocation)? That informs how much negotiation room exists.
- Schools are D-rated, which usually means shorter tenancies and higher turnover. Who's the typical renter profile here, and what's been the actual vacancy rate?
- Crime grade is D in this area — have there been break-ins, vandalism, or insurance claims at this property in the last 3 years? What carrier currently insures it and at what premium?
- What's the average days-on-market for RENTAL listings here right now (not sales)? A rising rental-DOM trend means longer vacancies and softer asking-rent achievability than the comps imply.
- What's the recent tenant-quality profile in this submarket — average credit score on applications, eviction rate, late-payment / NSF rate, and stable-employment percentage? A property-management company in the area should have these aggregated.
- How much new for-sale + rental construction is in the pipeline within 1–3 miles? Heavy new supply typically softens prices + rents 12–24 months out; constrained supply supports both.
Investment metrics
- 1% rule
- 3.86% ✓
- Cap rate
- 33.36%
- Cash-on-cash
- 96.66%
- DSCR
- 5.30
- GRM
- 2.2
CMA / ARV
- ARV (on-the-fly)
- $54,756
- Comps found
- 12
Show comp detail 12 sales within ~0.75 mi
| Address | Dist | Beds/Ba | Sqft | Sold | Price | $/sf | Match |
|---|---|---|---|---|---|---|---|
| 10035 Clairmont Dr | 0.12mi | 2/1.0 (+1) | 735 (+5%) | 1mo | $74,900 | $102 | 80 |
| 10138 Imperial Dr | 0.08mi | 2/2.0 (+1) | 648 (-8%) | 1mo | $14,000 | $22 | 74 |
| 10157 Winkler Dr | 0.24mi | 2/1.0 (+1) | 792 (+13%) | 5mo | $60,000 | $76 | 59 |
| 9604 Winkler Dr | 0.70mi | 2/1.0 (+1) | 720 (+3%) | 2mo | $39,000 | $54 | 57 |
| 10185 Winkler Dr | 0.29mi | 2/1.0 (+1) | 792 (+13%) | 8mo | $35,000 | $44 | 54 |
| 9843 Green Valley Dr | 0.42mi | 2/1.0 (+1) | 768 (+9%) | 8mo | $60,000 | $78 | 53 |
| 10175 Cloverdale Dr | 0.35mi | 2/1.0 (+1) | 792 (+13%) | 8mo | $65,000 | $82 | 51 |
| 9828 Lorna Ln | 0.50mi | 2/1.0 (+1) | 792 (+13%) | 2mo | $65,000 | $82 | 49 |
| 10246 Dacey Dr | 0.50mi | 2/2.0 (+1) | 768 (+9%) | 7mo | $58,400 | $76 | 46 |
| 9859 Vickie Pl | 0.52mi | 2/1.0 (+1) | 792 (+13%) | 6mo | $81,000 | $102 | 44 |
| 9606 Lifford Ct | 0.67mi | 2/1.0 (+1) | 800 (+14%) | 1mo | $130,000 | $163 | 40 |
| 324 N Floridale Ave | 0.71mi | 2/1.0 (+1) | 624 (-11%) | 6mo | $35,000 | $56 | 38 |
Match score weights: distance 35% · size 25% · config 20% · recency 20%. Top-matched comps best support the ARV.
Projected returns pro-forma
3.79% appreciation · 4.97% rent growth · sell at horizon
- IRR
- 28.0%
- Equity multiple
- 2.72×
- Total profit
- $10,865
- Equity at exit
- $11,133
- IRR
- 30.8%
- Equity multiple
- 6.32×
- Total profit
- $33,490
- Equity at exit
- $17,992
Cash invested: $6,300 (down + closing). Projections, not guarantees.
Landlord ↔ Tenant lean methodology
- Overall (STATE)
- 81 Strongly Landlord-Friendly
- State Missouri
- 81 Strongly Landlord-Friendly · R+10
- County
- — inherits STATE
- City
- — inherits STATE
ZIP-level market 63136
- Home prices YoY
- 0.9%
- Rents YoY
- 5.0%
- Active inventory
- 376
- Price-to-rent
- 2.2×
Monthly cashflow live
- Estimated rent
- $868 high interval (Pro) →
- Mortgage (P&I)
- −$118
- Tax from tax record
- −$51 /mo · $615/yr
- Insurance
- −$9
- Flood insurance flood zone
- −$427 /mo · $5,118/yr
- HOA
- −$0
- Vacancy / Maint / Mgmt
- −$182
- Net cashflow
- $81
Break-even live
Sensitivity live
| Price | -10% $94 | -5% $87 | +0% $81 | +5% $75 | +10% $68 |
|---|---|---|---|---|---|
| Rent | -10% $12 | -5% $47 | +0% $81 | +5% $115 | +10% $150 |
| Rate | -1.0pp $92 | -0.5pp $87 | base $81 | +0.5pp $75 | +1.0pp $69 |
UW: 25.0% down · 7.5% · 30yr · 1.5% tax · 5.0% vac · 8.0% maint · 8.0% mgmt
Financing live
Cash to close
- Down payment
- $5,625
- Closing costs
- $675
- Reserves months
- —
- Total cash needed
- —
Loan-product check · same deal, 3 products live
Conventional
25% down · 7.5% · 30yr
- Down + closing
- —
- Monthly P&I
- —
- Monthly cashflow
- —
- DSCR
- —
- Eligible?
- —
Personal DTI + credit; lowest rate.
DSCR
20% down · 8.5% · 30yr
- Down + closing
- —
- Monthly P&I
- —
- Monthly cashflow
- —
- DSCR
- —
- Eligible?
- —
No personal income docs; deal must DSCR.
Hard money
10% down · 12.0% · 12mo
- Down + closing
- —
- Monthly P&I
- —
- Monthly cashflow
- —
- DSCR
- —
- Eligible?
- —
Short-term bridge; refi at stabilization.
Rent comps 5 comps
| Address | Beds | Baths | Sqft | Rent | $/sqft | DOM | Units | Dist |
|---|---|---|---|---|---|---|---|---|
| 10032 Neville Walk Unit 10016C St. Louis, MO | 1.0 | 1.0 | 720 | $855 | $1.19 | 0d | 1 | 0.23mi |
| 2155 Hecht Ave St. Louis, MO | 1.0–2.0 | 1.0 | 673 | $702 | $1.04 | 0d | 23 | 0.79mi |
| 1550 Northwinds Estates Dr St. Louis, MO | 1.0–2.0 | 1.0–1.5 | 877 | $810 | $0.92 | 45d | 1 | 0.99mi |
| 2974 Coppercreek Rd St. Louis, MO | 1.0–2.0 | 1.0 | 705 | $750 | $1.06 | 0d | 6 | 1.02mi |
| 8893 Maya Ln Jennings, MO | 1.0–2.0 | 1.0 | 600 | $780 | $1.30 | 0d | 6 | 1.48mi |
Listing history 4 events
-
2026-06-21days on market $22,500 Active 5 DOM
-
2026-06-18days on market $22,500 Active 2 DOM
-
2026-06-17remarks 552-char remark
-
2026-06-17$22,500 Active 1 DOM
ⓘ Source: listings_history table (triggers on properties + properties_extension) + one-shot
backfill from property_details.listing_events for pre-trigger history.
Tax reassessment forecast MO · Resets to sale price
- Current annual tax
- $615 · $51/mo
- Projected year-2 tax
- $615 · $51/mo
- Expected delta
- $0/yr ($0/mo · 0.0%)
ⓘ Screening estimate from a state-policy table — verify with the county assessor before closing.
Climate risk First Street
- Flood 6/10 Major FEMA zone AE · 70% chance over 30 yrs
- Wildfire 1/10 Low
- Heat 4/10 Moderate 7 d/yr ≥106°F today · 20 d/yr by 30 yrs out
- Wind 2/10 Low 100% chance of damaging wind over 30 yrs
- Air quality 3/10 Moderate 3 unhealthy d/yr today · 5 by 30 yrs out
Nearby sold comps map
Loading sold comps map…
Walkable amenities ~0.75 mi
Loading nearby amenities…
Taxation est. · year 1
- Rental income
- $10,422
- − Mortgage interest
- −$1,260
- − Property taxes
- −$615
- − Insurance
- −$5,231
- − Repairs & maintenance
- −$834
- − Management
- −$834
- − Depreciation
- −$655
- Taxable income
- $993
- Est. tax owed @ 24.0%
- −$238
- After-tax cash flow
- $733/yr
For passive investors: Depreciation is non-cash, so a rental often shows a tax loss while cash-flowing — sheltering income. Rental losses are passive: they offset passive income freely, and up to $25,000/yr can offset ordinary (W-2) income if you actively participate and your MAGI is under $100k (phasing out to $0 by $150k); unused losses carry forward. On sale, claimed depreciation is recaptured at up to 25%, and gains may owe capital-gains tax (a 1031 exchange can defer both). Figures are a year-1 estimate at your 24.0% rate — not tax advice; consult a CPA.
Schools (NCES district)
- District
- Riverview Gardens
- NCES district ID
- 2926670
- Math proficiency
- 2% ▼ -6.00%
- Reading proficiency
- 9% ▼ -6.00%
- Median HH income
- $32,759
- Composite
- 4.22/100
- National rank
- #10058
- State rank
- #324 of 324 in MO
Livability — Dellwood
- Score
- 66/100
- State rank
- #239
- US rank
- #11618
Category grades
Schools grade is shown separately in the Schools card above.
Census & demographics
- County
- Saint Louis County · 888,823 people
- Metro
- St. Louis, MO-IL
- Population (ZIP)
- 40,929
- Household income
- $41,154
- Rent vs Own
- Severe rent burden
- 3085.0
Population outlook (St. Louis County) Hauer SSP2
- Today (2025)
- 1,025,227 people
- By 2030
- 1,028,023 · +0.3%
- By 2040
- 1,020,940 · -0.4%
- By 2050
- 1,007,280 · -1.8%
- By 2075
- 987,277 · -3.7%
- By 2100
- 921,984 · -10.1%
Race, ethnicity, and origin ACS 2023
- Neighborhood character
- Predominantly Black (90%)
- Race & ethnicity
- Black 90% White 5% Two or more races 3%
- Foreign-born
- 1% · Canada
Political lean MEDSL · St. Louis
- 2024 margin
- Strong D (+23.4) · D 60.8% · R 37.4% · Other 1.7%
- 2008→2024 swing
- +3.5pp toward D · 2008: 19.9pp · 2024: 23.4pp
- All cycles
- 2024: D+23.4 2020: D+24.0 2016: D+16.2 2012: D+13.7 2008: D+19.9
Not yet ingested
- Civics
- —
Market trends
- HPI YoY
- ▲ 3.79%
- Current HPI
- 420.28
- Rent YoY
- ▲ 4.97%
- Metro
- St. Louis, MO-IL
- State GDP YoY
- ▲ 1.84%
- F500 in state
- 20
Industry mix (Fortune 500 HQ in MO)
| Industry | F500 HQs | Revenue |
|---|---|---|
| Healthcare | 1 | $163B |
|
||
| Insurance | 1 | $21B |
|
||
| Industrial Technology | 1 | $17B |
|
||
| Retail | 1 | $16B |
|
||
| Industrial Distribution | 1 | $10B |
|
||
| Utilities | 1 | $9B |
|
||
Price history
+104.5% since first listed5 events — show timeline
- 2026-06-16 Listed $22,500 MARIS as Distributed by MLS Grid
- 2014-09-22 Sold (Public Records) $15,000 Public Records
- 2014-09-10 Sold (Public Records) $11,000 Public Records
- 1998-03-12 Sold (Public Records) — Public Records
- 1989-05-01 Sold (Public Records) — Public Records
Property tax history
-5.3%/yrLatest (2022): $615 · +0.4% YoY. Source: county tax records.
Cash-flow waterfall
monthlySold comps — $/sqft
last 12 mo · ≤1 miLoading sold comps…