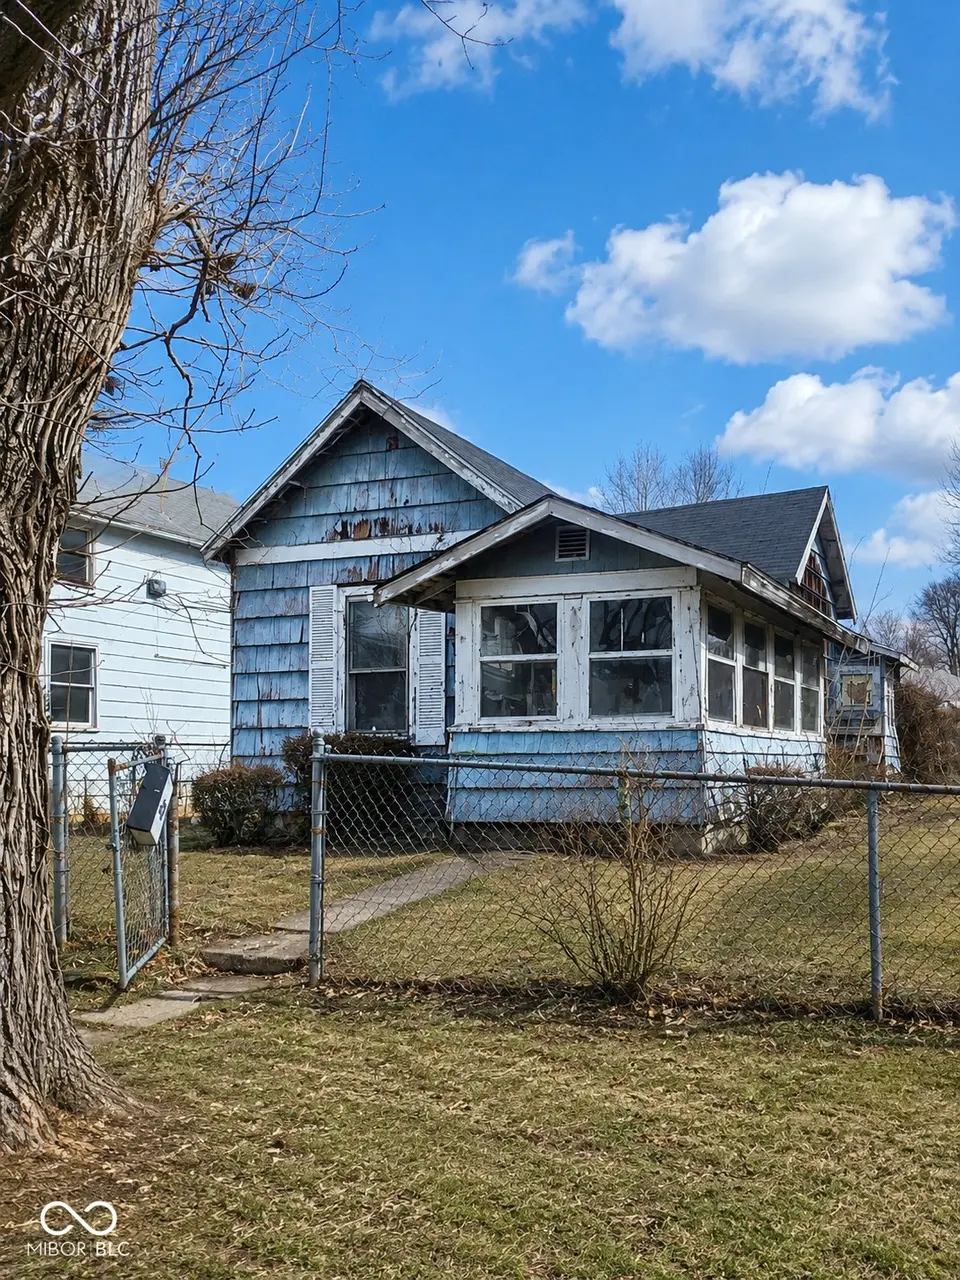
2405 S Boots St
Marion, IN 46953
$5,000C+
3 bd · 1.0 ba ·
1,124 sqft ·
Built 1939
· SingleFamily
· Active
· 18 DOM
Cashflow @ list (25.0% down · 7.5%)
Estimated rent
$1,185/mo
Mortgage (P&I)
−$501
Tax + insurance
−$57
HOA
−$0
Vac / Maint / Mgmt
−$249
Net cashflow
$378/mo
Annual
$4,540/yr
Cap rate
11.04%
Cash-on-cash
16.97%
DSCR
1.76
1% rule
1.24%
Cash to close
$26,751
Investor read
- This is a 3-bed/1.0-bath single-family listed at $5k.
- At list price, monthly cash flow is $378 ($5k/yr) — positive.
- The deal already cash-flows at list — no discount required.
- Meets the 1% rule at list price ($1k rent vs $5k).
- It's been on market 18 days — a 2% lower offer ($5k) is reasonable based on typical stale-listing flexibility.
- Recommended offer: $5k (1.5% below list) — sets the bar for market timing.
- Local home prices are declining (-3.0%/yr); year-one equity from $661 of loan paydown is wiped out by about $3k of value loss. Plan a longer hold.
- Location reads 65/100 on livability (#337 in IN) — a middle-class / working-renter tenant base. Strengths: crime A+, cost of living A+, housing A+; Watch: schools F, amenities F, commute F.
- Marion Community Schools (town): math 18% / reading 24% proficiency, ranked #277 of 301 in IN (top 92%) — low school quality limits family demand, transient renter base, plan for 1-2y turnover; 67% free/reduced lunch — lower-income household profile, screen leases tightly.
- Watch-outs: property tax is 4.2% of price; built in 1939 — expect roof / HVAC / electrical / plumbing capex.
- Market conditions: 112 active listings in the ZIP; 1 comparable units currently listed for rent nearby; 52 units permitted in Grant County in 2024 (8 in 5+ unit buildings).
- Grant County population projected at -18% by 2050 — secular population decline; favor cash flow + early exit over multi-decade hold.
- 3 sale attempts since 9y ago with the ask held roughly flat each time — persistent listings suggest the price (not the market) is what's stuck; bring a comps-based counter.
- At projected returns (-3.0% appreciation + 3.0% rent growth), your $27k cash investment doubles in ~8 years — after that, you're playing with house money.
- Cap rate 11.0% vs local median 8.7% in Marion — meaningfully above typical; check what's discounted (condition, days-on-market, listing class) to confirm the premium yield is real.
- This rent runs 31% of the median local income ($46k/yr) — at the standard rent-burdened threshold; future hikes will face affordability resistance.
Questions for listing agent
- Built in 1939 — when were the roof, HVAC, electrical panel, plumbing, and water heater last replaced?
- Property tax is high relative to price — has the assessment been appealed recently, and will the sale trigger a re-assessment?
- Is there a deadline driving the sale (1031 exchange, divorce, estate, relocation)? That informs how much negotiation room exists.
- Schools are F-rated, which usually means shorter tenancies and higher turnover. Who's the typical renter profile here, and what's been the actual vacancy rate?
- What's the average days-on-market for RENTAL listings here right now (not sales)? A rising rental-DOM trend means longer vacancies and softer asking-rent achievability than the comps imply.
- What's the recent tenant-quality profile in this submarket — average credit score on applications, eviction rate, late-payment / NSF rate, and stable-employment percentage? A property-management company in the area should have these aggregated.
- How much new for-sale + rental construction is in the pipeline within 1–3 miles? Heavy new supply typically softens prices + rents 12–24 months out; constrained supply supports both.
CashFlowRE · CFR-H5VMCD57SGY88G
· Data 1 day ago
cashflowre.app · 2026-05-29