 🔨 Auction
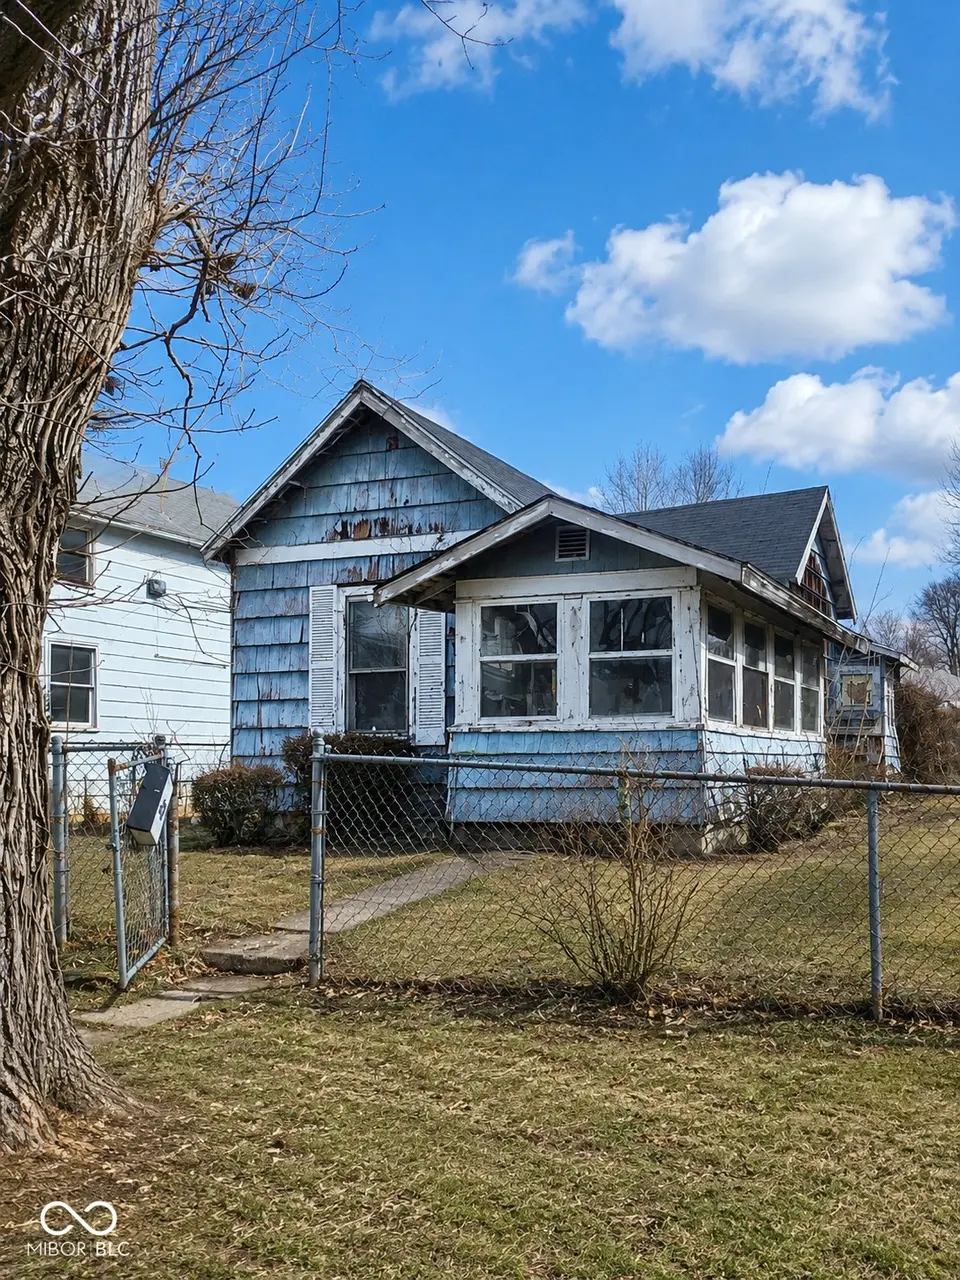
2405 S Boots St · Marion, IN
Flood risk 1/10 · Minimal
- FEMA flood zone
- X (unshaded)
- Chance of flooding over 30 yrs
- 0.0%
- Est. flood insurance / yr
- $507 – $1,088
Fire risk 1/10 · Minimal
- Est. fire insurance / yr
- $717 – $1,331
Heat risk 3/10 · Minor
- Hot days now (above 100°F)
- 7 days/yr
- Hot days in 30 yrs
- 18 days/yr
Wind risk 2/10 · Minimal
- Chance of severe wind over 30 yrs
- —
Air-quality risk 2/10 · Minimal
- Unhealthy air days now
- 1 days/yr
- Unhealthy air days in 30 yrs
- 2 days/yr
Risk factors via First Street. Map © Google.
Why this score? — see what drove the C+ grade
The composite is a weighted blend of 9 inputs, each scored 0–100. Each bar is that input's sub-score; the figure is the points it added to the 100-point composite (weight × sub-score).
- Cash flow +30.0/30.0
- DSCR +10.0/10.0
- ARV discount +7.5/15.0
- 1% rule +7.4/10.0
- Livability +3.2/5.0
- Rent growth +2.5/5.0
- Condition / age +2.5/5.0
- Schools +1.7/10.0
- Appreciation +0.0/10.0
$5,000
🖨 Deal sheet 📄 Offer letter ✓ Due diligence
Listing remarks
Online-only no-reserve auction opportunity in Marion! Bidding will end on June 18 at noon. This 2-bedroom, 1-bath home is ready for a full renovation and offers a low-entry opportunity for investors, flippers, or buyers looking for their next major rehab project. The home is being sold strictly as-is and will require extensive work throughout, but the existing layout provides a practical footprint with a living room, dining/flex space, kitchen, two bedrooms, bath, hallway/closet area, enclosed front porch/sunroom, rear enclosed porch, and rear canopy area. The conceptual floor plan provides approximately 1,120 SF of main finished layout, plus additional enclosed porch/canopy spaces, to be v
Key facts
- Convenient access
- Rear enclosed porch
- Full renovation
Tags
Property features AI
Finance
- Other: Residential property in fixer condition; Lot under 1/4 acre (approximately 0.11 acres)
Exterior
- Parking: Detached parking (no garage spaces)
- Utilities: Public water; Municipal sewer connected; Solid waste service available
- Home design: Single-family residence; One story; West-facing
- Construction: Shingle siding; Block foundation
- Exterior features: City lot with mature trees; Property offers access
Interior
- Kitchen: No appliances included
- Bedrooms: 2 bedrooms on the main level
- Bathrooms: 1 full bathroom on the main level
- Heating & cooling: No heating; No cooling
- Interior features: Attic access
Neighborhood map
What this means for you Summary
Snapshot
- This is a 3-bed/1.0-bath single-family listed at $5k.
Deal economics
- At list price, monthly cash flow is $378 ($5k/yr) — positive.
- The deal already cash-flows at list — no discount required.
- Meets the 1% rule at list price ($1k rent vs $5k).
- Recommended offer: $5k (1.5% below list) — sets the bar for market timing.
- Cap rate 11.0% vs local median 8.7% in Marion — meaningfully above typical; check what's discounted (condition, days-on-market, listing class) to confirm the premium yield is real.
Location & tenants
- Location reads 65/100 on livability (#337 in IN) — a middle-class / working-renter tenant base. Strengths: crime A+, cost of living A+, housing A+; Watch: schools F, amenities F, commute F.
- Marion Community Schools (town): math 18% / reading 24% proficiency, ranked #277 of 301 in IN (top 92%) — low school quality limits family demand, transient renter base, plan for 1-2y turnover; 67% free/reduced lunch — lower-income household profile, screen leases tightly.
- Market conditions: 112 active listings in the ZIP; 1 comparable units currently listed for rent nearby; 52 units permitted in Grant County in 2024 (8 in 5+ unit buildings).
- This rent runs 31% of the median local income ($46k/yr) — at the standard rent-burdened threshold; future hikes will face affordability resistance.
Forward outlook
- Local home prices are declining (-3.0%/yr); year-one equity from $661 of loan paydown is wiped out by about $3k of value loss. Plan a longer hold.
- Grant County population projected at -18% by 2050 — secular population decline; favor cash flow + early exit over multi-decade hold.
- At projected returns (-3.0% appreciation + 3.0% rent growth), your $27k cash investment doubles in ~8 years — after that, you're playing with house money.
Negotiation context
- It's been on market 18 days — a 2% lower offer ($5k) is reasonable based on typical stale-listing flexibility.
- 3 sale attempts since 9y ago with the ask held roughly flat each time — persistent listings suggest the price (not the market) is what's stuck; bring a comps-based counter.
Risks & watch-outs
- Watch-outs: property tax is 4.2% of price; built in 1939 — expect roof / HVAC / electrical / plumbing capex.
Questions for the listing agent
- Built in 1939 — when were the roof, HVAC, electrical panel, plumbing, and water heater last replaced?
- Property tax is high relative to price — has the assessment been appealed recently, and will the sale trigger a re-assessment?
- Is there a deadline driving the sale (1031 exchange, divorce, estate, relocation)? That informs how much negotiation room exists.
- Schools are F-rated, which usually means shorter tenancies and higher turnover. Who's the typical renter profile here, and what's been the actual vacancy rate?
- What's the average days-on-market for RENTAL listings here right now (not sales)? A rising rental-DOM trend means longer vacancies and softer asking-rent achievability than the comps imply.
- What's the recent tenant-quality profile in this submarket — average credit score on applications, eviction rate, late-payment / NSF rate, and stable-employment percentage? A property-management company in the area should have these aggregated.
- How much new for-sale + rental construction is in the pipeline within 1–3 miles? Heavy new supply typically softens prices + rents 12–24 months out; constrained supply supports both.
Investment metrics
- 1% rule
- 1.24% ✓
- Cap rate
- 11.04%
- Cash-on-cash
- 16.97%
- DSCR
- 1.76
- GRM
- 6.7
CMA / ARV
- ARV (on-the-fly)
- $95,540
- Comps found
- 12
Show comp detail 12 sales within ~0.75 mi
| Address | Dist | Beds/Ba | Sqft | Sold | Price | $/sf | Match |
|---|---|---|---|---|---|---|---|
| 2520 S Selby St | 0.31mi | 3/1.0 | 1,152 (+2%) | 10mo | $105,000 | $91 | 73 |
| 617 E 27th St | 0.43mi | 3/1.0 | 1,212 (+8%) | 2mo | $40,000 | $33 | 65 |
| 114 W 30th St | 0.37mi | 3/1.0 | 1,188 (+6%) | 13mo | $25,000 | $21 | 62 |
| 2922 S Nebraska St | 0.41mi | 2/1.0 (-1) | 1,160 (+3%) | 12mo | $500 | — | 60 |
| 2114 S Branson St | 0.23mi | 3/1.5 | 1,000 (-11%) | 10mo | $120,000 | $120 | 60 |
| 2809 S Landess St | 0.53mi | 2/1.0 (-1) | 1,054 (-6%) | 9mo | $90,000 | $85 | 52 |
| 2906 S Hamaker St | 0.53mi | 3/1.0 | 1,008 (-10%) | 8mo | $110,000 | $109 | 52 |
| 2910 S Brownlee St | 0.53mi | 3/1.0 | 1,015 (-10%) | 10mo | $10,250 | $10 | 50 |
| 2500 S Waite St | 0.68mi | 3/1.0 | 1,180 (+5%) | 13mo | $47,000 | $40 | 49 |
| 1818 S Nebraska St | 0.36mi | 3/1.0 | 960 (-15%) | 12mo | $97,000 | $101 | 49 |
| 1616 S Mcclure St | 0.51mi | 2/1.0 (-1) | 972 (-14%) | 2mo | $20,000 | $21 | 47 |
| 2203 S Valley Ave | 0.56mi | 2/1.0 (-1) | 982 (-13%) | 10mo | $134,900 | $137 | 40 |
Match score weights: distance 35% · size 25% · config 20% · recency 20%. Top-matched comps best support the ARV.
Projected returns pro-forma
-3.0% appreciation · 3.0% rent growth · sell at horizon
- IRR
- 8.2%
- Equity multiple
- 1.32×
- Total profit
- $8,568
- Equity at exit
- $14,245
- IRR
- 17.4%
- Equity multiple
- 2.43×
- Total profit
- $38,305
- Equity at exit
- $8,261
Cash invested: $26,751 (down + closing). Projections, not guarantees.
Landlord ↔ Tenant lean methodology
- Overall (STATE)
- 90 Strongly Landlord-Friendly
- State Indiana
- 90 Strongly Landlord-Friendly · R+11
- County
- — inherits STATE
- City
- — inherits STATE
ZIP-level market 46953
- Home prices YoY
- -23.4%
- Active inventory
- 112
- Price-to-rent
- 0.4×
Monthly cashflow live
- Estimated rent
- $1,185 medium interval (Pro) →
- Mortgage (P&I)
- −$501
- Tax from tax record
- −$17 /mo · $208/yr
- Insurance
- −$40
- HOA
- −$0
- Vacancy / Maint / Mgmt
- −$249
- Net cashflow
- $378
Break-even live
UW: 25.0% down · 7.5% · 30yr · 1.5% tax · 5.0% vac · 8.0% maint · 8.0% mgmt
Financing live
Cash to close
- Down payment
- $23,885
- Closing costs
- $2,866
- Reserves months
- —
- Total cash needed
- —
Loan-product check · same deal, 3 products live
Conventional
25% down · 7.5% · 30yr
- Down + closing
- —
- Monthly P&I
- —
- Monthly cashflow
- —
- DSCR
- —
- Eligible?
- —
Personal DTI + credit; lowest rate.
DSCR
20% down · 8.5% · 30yr
- Down + closing
- —
- Monthly P&I
- —
- Monthly cashflow
- —
- DSCR
- —
- Eligible?
- —
No personal income docs; deal must DSCR.
Hard money
10% down · 12.0% · 12mo
- Down + closing
- —
- Monthly P&I
- —
- Monthly cashflow
- —
- DSCR
- —
- Eligible?
- —
Short-term bridge; refi at stabilization.
Rent comps 1 comps
| Address | Beds | Baths | Sqft | Rent | $/sqft | DOM | Units | Dist |
|---|---|---|---|---|---|---|---|---|
| 703 E 28th St Marion, IN | 2.0 | 1.0 | 1085 | $1,200 | $1.11 | 43d | 1 | 0.48mi |
Listing history 12 events
-
2026-06-19days on market $5,000 Active 18 DOM
-
2026-06-18days on market $5,000 Active 17 DOM
-
2026-06-17days on market $5,000 Active 16 DOM
-
2026-06-16days on market $5,000 Active 15 DOM
-
2026-06-15days on market $5,000 Active 14 DOM
-
2026-06-14days on market $5,000 Active 12 DOM
-
2026-06-12days on market $5,000 Active 11 DOM
-
2026-06-09days on market $5,000 Active 8 DOM
-
2026-06-08days on market $5,000 Active 7 DOM
-
2026-06-07days on market $5,000 Active 6 DOM
-
2026-06-02remarks 699-char remark
-
2026-06-02$5,000 Active 1 DOM
ⓘ Source: listings_history table (triggers on properties + properties_extension) + one-shot
backfill from property_details.listing_events for pre-trigger history.
Tax reassessment forecast IN · Partial reset (capped growth)
- Current annual tax
- $208 · $17/mo
- Projected year-2 tax
- $208 · $17/mo
- Expected delta
- $0/yr ($0/mo · 0.0%)
ⓘ Screening estimate from a state-policy table — verify with the county assessor before closing.
Climate risk First Street
- Flood 1/10 Low FEMA zone X (unshaded) · 0% chance over 30 yrs
- Wildfire 1/10 Low
- Heat 3/10 Moderate 7 d/yr ≥100°F today · 18 d/yr by 30 yrs out
- Wind 2/10 Low
- Air quality 2/10 Low 1 unhealthy d/yr today · 2 by 30 yrs out
Nearby sold comps map
Loading sold comps map…
Walkable amenities ~0.75 mi
Loading nearby amenities…
Taxation est. · year 1
- Rental income
- $14,225
- − Mortgage interest
- −$5,352
- − Property taxes
- −$208
- − Insurance
- −$478
- − Repairs & maintenance
- −$1,138
- − Management
- −$1,138
- − Depreciation
- −$2,779
- Taxable income
- $3,132
- Est. tax owed @ 24.0%
- −$752
- After-tax cash flow
- $3,788/yr
For passive investors: Depreciation is non-cash, so a rental often shows a tax loss while cash-flowing — sheltering income. Rental losses are passive: they offset passive income freely, and up to $25,000/yr can offset ordinary (W-2) income if you actively participate and your MAGI is under $100k (phasing out to $0 by $150k); unused losses carry forward. On sale, claimed depreciation is recaptured at up to 25%, and gains may owe capital-gains tax (a 1031 exchange can defer both). Figures are a year-1 estimate at your 24.0% rate — not tax advice; consult a CPA.
Schools (NCES district)
- District
- Marion Community Schools
- NCES district ID
- 1806390
- Math proficiency
- 18% ▼ -9.00%
- Reading proficiency
- 24% ▼ -6.00%
- Median HH income
- $33,415
- Composite
- 17.13/100
- National rank
- #9115
- State rank
- #277 of 301 in IN
Livability — Marion
- Score
- 65/100
- State rank
- #337
- US rank
- #13006
Category grades
Schools grade is shown separately in the Schools card above.
Census & demographics
- Census place
- Marion, IN
- County
- Grant County · 41,561 people
- City population
- 41,561
- Metro
- Marion, IN
- Population (ZIP)
- 23,372
- Household income
- $46,288
- Rent vs Own
- Severe rent burden
- 597.0
Population outlook (Grant County) Hauer SSP2
- Today (2025)
- 64,394 people
- By 2030
- 62,145 · -3.5%
- By 2040
- 57,252 · -11.1%
- By 2050
- 52,968 · -17.7%
- By 2075
- 45,986 · -28.6%
- By 2100
- 39,400 · -38.8%
Race, ethnicity, and origin ACS 2023
- Neighborhood character
- Predominantly White (77%)
- Race & ethnicity
- White 77% Black 10% Two or more races 9% Hispanic / Latino 6%
- Hispanic origin (detail)
- Mexican 4%
- Common ancestry
- Italian 3% Iranian 1% Slovak 1%
- Foreign-born
- 2% · Canada
- Languages at home
- 96% English-only · Spanish 3%
Political lean MEDSL · Grant
- 2024 margin
- Solid R (+41.8) · D 28.2% · R 70.0% · Other 1.9%
- 2008→2024 swing
- -28.7pp toward R · 2008: -13.1pp · 2024: -41.8pp
- All cycles
- 2024: R+41.8 2020: R+38.8 2016: R+39.5 2012: R+22.0 2008: R+13.1
Not yet ingested
- Civics
- —
Market trends
- HPI YoY
- ▼ -52.47%
- Current HPI
- 171.7246
- Rent YoY
- —
- Metro
- Marion, IN
- State GDP YoY
- ▲ 2.90%
- F500 in state
- 18
Industry mix (Fortune 500 HQ in IN)
| Industry | F500 HQs | Revenue |
|---|---|---|
| Industrial Machinery | 2 | $37B |
|
||
| Healthcare | 1 | $177B |
|
||
| Pharmaceuticals | 1 | $45B |
|
||
| Metals / Steel | 1 | $18B |
|
||
| Agriculture | 1 | $17B |
|
||
| Packaging | 1 | $12B |
|
||
Price history
-44.4% since first listed5 events — show timeline
- 2026-06-01 Listed $5,000 MIBOR as Distributed by MLS Grid
- 2019-03-31 Listing Removed — MIBOR as Distributed by MLS Grid
- 2018-04-24 Listed $9,000 MIBOR as Distributed by MLS Grid
- 2017-10-31 Listing Removed — MIBOR as Distributed by MLS Grid
- 2017-04-26 Listed $9,000 MIBOR as Distributed by MLS Grid
Property tax history
-1.1%/yrLatest (2025): $208 · +7.2% YoY. Source: county tax records.
Cash-flow waterfall
monthlySold comps — $/sqft
last 12 mo · ≤1 miLoading sold comps…