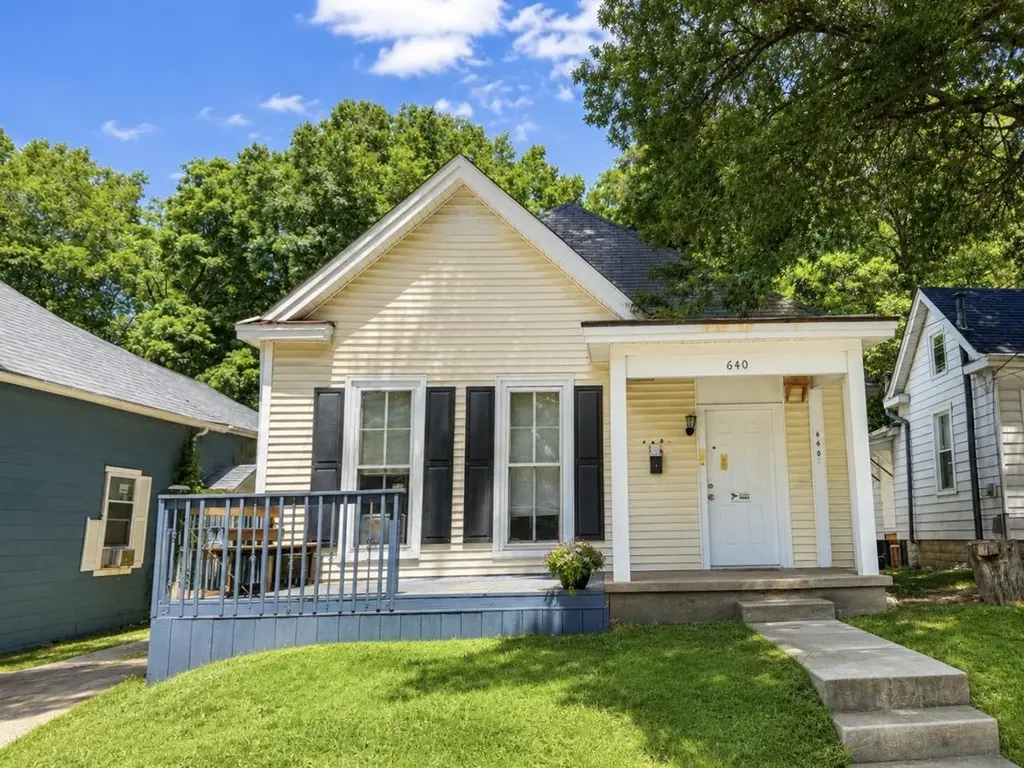
640 E 14th Ave
Bowling Green, KY 42101
$174,900D+
2 bd · 1.0 ba ·
1,656 sqft ·
Built 1910
· SingleFamily
· Active
· 11 DOM
Cashflow @ list (25.0% down · 7.5%)
Estimated rent
$1,391/mo
Mortgage (P&I)
−$917
Tax + insurance
−$114
HOA
−$0
Vac / Maint / Mgmt
−$292
Net cashflow
$67/mo
Annual
$810/yr
Cap rate
6.76%
Cash-on-cash
1.65%
DSCR
1.07
1% rule
0.80%
Cash to close
$48,972
Investor read
- This is a 2-bed/1.0-bath single-family listed at $175k.
- At list price, monthly cash flow is $67 ($810/yr) — positive.
- The deal already cash-flows at list — no discount required.
- To meet the 1% rule (rent ≥ 1% of price), the offer needs to be $139k (20.5% below list).
- Only 11 days on market — expect competitive offers; lowballing is unlikely to land.
- Recommended offer: $139k (20.5% below list) — sets the bar for 1% rule.
- Local home prices are declining (-3.0%/yr); year-one equity from $1k of loan paydown is wiped out by about $5k of value loss. Plan a longer hold.
- Location reads 65/100 on livability (#255 in KY) — a middle-class / working-renter tenant base. Strengths: cost of living A+, housing A+; Watch: crime C-, amenities F, commute F.
- Bowling Green Independent (urban): math 37% / reading 41% proficiency, ranked #44 of 165 in KY (top 27%) — families likely to look elsewhere, expect single-tenant / working-renter base with shorter leases.
- Zoned schools: T C Cherry Elementary School (math 17% / reading 27%, grade F, #525 of 676 statewide, top 82%, 428 students, 84% FRL); Bowling Green Junior High (math 37% / reading 46%, grade F, #51 of 217 statewide, top 24%, 963 students, 65% FRL); Bowling Green High School (math 39% / reading 39%, grade F, #51 of 254 statewide, top 21%, 1,294 students, 58% FRL) — zoned schools average 69% FRL vs 53% district-wide (16 pts higher); higher-poverty schools than district average — tighter screening recommended.
- Watch-outs: built in 1910 — expect roof / HVAC / electrical / plumbing capex.
- Market conditions: Rents flat; 591 active listings in the ZIP; 11 comparable units currently listed for rent nearby; rentals at typical pace (median 21d on market — plan ~3-4 weeks tenant-placement turnaround); 2,286 units permitted in Warren County in 2024 (1,410 in 5+ unit buildings).
- Warren County population projected at +41% by 2050 — long-run rental-demand tailwind backs the buy-and-hold thesis.
- 5 sale attempts since 7y ago with the ask held roughly flat each time — persistent listings suggest the price (not the market) is what's stuck; bring a comps-based counter.
- Current owner paid $140k; 25% above their basis — modest negotiation headroom, anchor on the comps not their cost.
- Climate carrying-cost: extreme-heat days projected 7→19/yr by 2055 (HVAC capex compounding) — expect insurance premiums to compound above CPI over the hold.
- Cap rate 6.8% vs local median 3.2% in Bowling Green — top-decile yield for the area; either an underpriced asset or a hidden risk that comps aren't pricing in. Stress-test before assuming the spread holds.
- This rent runs 35% of the median local income ($48k/yr) — at the standard rent-burdened threshold; future hikes will face affordability resistance.
Questions for listing agent
- Built in 1910 — when were the roof, HVAC, electrical panel, plumbing, and water heater last replaced?
- Is there a deadline driving the sale (1031 exchange, divorce, estate, relocation)? That informs how much negotiation room exists.
- Schools are D-rated, which usually means shorter tenancies and higher turnover. Who's the typical renter profile here, and what's been the actual vacancy rate?
- The area grade is low — what's the realistic commute time and amenity access for the typical tenant pool here? Any planned neighborhood developments (good or bad) we should know about?
- What's the average days-on-market for RENTAL listings here right now (not sales)? A rising rental-DOM trend means longer vacancies and softer asking-rent achievability than the comps imply.
- What's the recent tenant-quality profile in this submarket — average credit score on applications, eviction rate, late-payment / NSF rate, and stable-employment percentage? A property-management company in the area should have these aggregated.
- How much new for-sale + rental construction is in the pipeline within 1–3 miles? Heavy new supply typically softens prices + rents 12–24 months out; constrained supply supports both.
CashFlowRE · CFR-H6THCS7AH0JDNJ
· Data 1 day ago
cashflowre.app · 2026-05-29