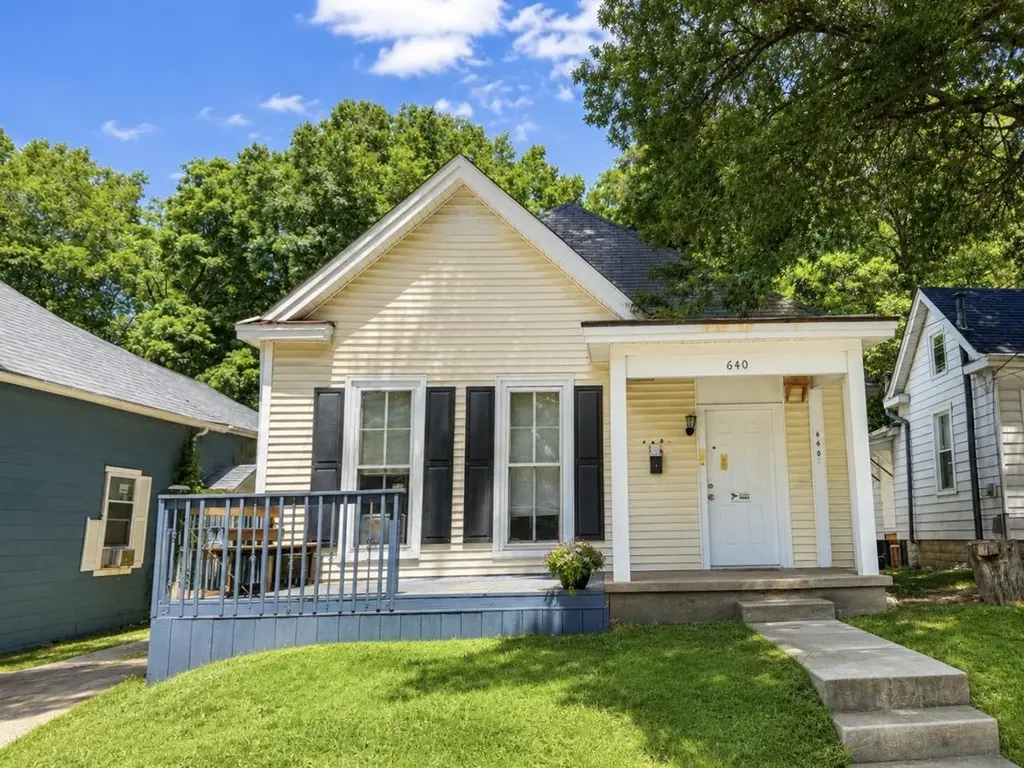
640 E 14th Ave · Bowling Green, KY
Flood risk 1/10 · Minimal
- FEMA flood zone
- X (unshaded)
- Chance of flooding over 30 yrs
- 0.0%
- Est. flood insurance / yr
- $507 – $1,088
Fire risk 1/10 · Minimal
- Est. fire insurance / yr
- $839 – $1,559
Heat risk 5/10 · Moderate
- Hot days now (above 107°F)
- 7 days/yr
- Hot days in 30 yrs
- 19 days/yr
Wind risk 2/10 · Minimal
- Chance of severe wind over 30 yrs
- 5.0%
Air-quality risk 2/10 · Minimal
- Unhealthy air days now
- 0 days/yr
- Unhealthy air days in 30 yrs
- 1 days/yr
Risk factors via First Street. Map © Google.
Why this score? — see what drove the D+ grade
The composite is a weighted blend of 9 inputs, each scored 0–100. Each bar is that input's sub-score; the figure is the points it added to the 100-point composite (weight × sub-score).
- Cash flow +15.4/30.0
- ARV discount +15.0/15.0
- DSCR +4.7/10.0
- Schools +3.2/10.0
- Livability +3.2/5.0
- 1% rule +3.0/10.0
- Rent growth +2.6/5.0
- Condition / age +2.5/5.0
- Appreciation +0.0/10.0
$174,900
🖨 Deal sheet 📄 Offer letter ✓ Due diligence
Key facts
- 6,534 sq ft lot
- Built 1910
- Listed 10 days
Property features AI
Finance
- Other: Accessible full bathroom; Lot approximately 0.15 acre
Exterior
- Utilities: Public water; Public sewer
- Home design: Single-family residence; Residential property
- Construction: Vinyl siding; Shingle roof
- Exterior features: Deck
Interior
- Kitchen: Range; Oven; Electric water heater
- Flooring: Laminate flooring
- Bathrooms: 2 full bathrooms (both on the main level)
- Heating & cooling: Central air conditioning; Forced air heating; Natural gas heating
- Interior features: Eat-in kitchen; Fireplace (1)
Neighborhood map
What this means for you Summary
Snapshot
- This is a 2-bed/1.0-bath single-family listed at $175k.
Deal economics
- At list price, monthly cash flow is $67 ($810/yr) — positive.
- The deal already cash-flows at list — no discount required.
- To meet the 1% rule (rent ≥ 1% of price), the offer needs to be $139k (20.5% below list).
- Recommended offer: $139k (20.5% below list) — sets the bar for 1% rule.
- Cap rate 6.8% vs local median 3.2% in Bowling Green — top-decile yield for the area; either an underpriced asset or a hidden risk that comps aren't pricing in. Stress-test before assuming the spread holds.
Location & tenants
- Location reads 65/100 on livability (#255 in KY) — a middle-class / working-renter tenant base. Strengths: cost of living A+, housing A+; Watch: crime C-, amenities F, commute F.
- Bowling Green Independent (urban): math 37% / reading 41% proficiency, ranked #44 of 165 in KY (top 27%) — families likely to look elsewhere, expect single-tenant / working-renter base with shorter leases.
- Zoned schools: T C Cherry Elementary School (math 17% / reading 27%, grade F, #525 of 676 statewide, top 82%, 428 students, 84% FRL); Bowling Green Junior High (math 37% / reading 46%, grade F, #51 of 217 statewide, top 24%, 963 students, 65% FRL); Bowling Green High School (math 39% / reading 39%, grade F, #51 of 254 statewide, top 21%, 1,294 students, 58% FRL) — zoned schools average 69% FRL vs 53% district-wide (16 pts higher); higher-poverty schools than district average — tighter screening recommended.
- Market conditions: Rents flat; 591 active listings in the ZIP; 11 comparable units currently listed for rent nearby; rentals at typical pace (median 21d on market — plan ~3-4 weeks tenant-placement turnaround); 2,286 units permitted in Warren County in 2024 (1,410 in 5+ unit buildings).
- This rent runs 35% of the median local income ($48k/yr) — at the standard rent-burdened threshold; future hikes will face affordability resistance.
Forward outlook
- Local home prices are declining (-3.0%/yr); year-one equity from $1k of loan paydown is wiped out by about $5k of value loss. Plan a longer hold.
- Warren County population projected at +41% by 2050 — long-run rental-demand tailwind backs the buy-and-hold thesis.
Negotiation context
- Only 11 days on market — expect competitive offers; lowballing is unlikely to land.
- 5 sale attempts since 7y ago with the ask held roughly flat each time — persistent listings suggest the price (not the market) is what's stuck; bring a comps-based counter.
- Current owner paid $140k; 25% above their basis — modest negotiation headroom, anchor on the comps not their cost.
Risks & watch-outs
- Watch-outs: built in 1910 — expect roof / HVAC / electrical / plumbing capex.
- Climate carrying-cost: extreme-heat days projected 7→19/yr by 2055 (HVAC capex compounding) — expect insurance premiums to compound above CPI over the hold.
Questions for the listing agent
- Built in 1910 — when were the roof, HVAC, electrical panel, plumbing, and water heater last replaced?
- Is there a deadline driving the sale (1031 exchange, divorce, estate, relocation)? That informs how much negotiation room exists.
- Schools are D-rated, which usually means shorter tenancies and higher turnover. Who's the typical renter profile here, and what's been the actual vacancy rate?
- The area grade is low — what's the realistic commute time and amenity access for the typical tenant pool here? Any planned neighborhood developments (good or bad) we should know about?
- What's the average days-on-market for RENTAL listings here right now (not sales)? A rising rental-DOM trend means longer vacancies and softer asking-rent achievability than the comps imply.
- What's the recent tenant-quality profile in this submarket — average credit score on applications, eviction rate, late-payment / NSF rate, and stable-employment percentage? A property-management company in the area should have these aggregated.
- How much new for-sale + rental construction is in the pipeline within 1–3 miles? Heavy new supply typically softens prices + rents 12–24 months out; constrained supply supports both.
Investment metrics
- 1% rule
- 0.80% ✗
- Cap rate
- 6.76%
- Cash-on-cash
- 1.65%
- DSCR
- 1.07
- GRM
- 10.5
CMA / ARV
- ARV (on-the-fly)
- $238,464
- Comps found
- 10
Show comp detail 10 sales within ~0.75 mi
| Address | Dist | Beds/Ba | Sqft | Sold | Price | $/sf | Match |
|---|---|---|---|---|---|---|---|
| 1611 Park St | 0.34mi | 3/3.0 (+1) | 1,611 (-3%) | 14mo | $270,000 | $168 | 55 |
| 1227 Stubbins St | 0.74mi | 3/2.0 (+1) | 1,634 (-1%) | 5mo | $140,000 | $86 | 51 |
| 1501 Nutwood St | 0.51mi | 2/1.0 | 1,788 (+8%) | 16mo | $185,000 | $103 | 49 |
| 1032 Magnolia St | 0.62mi | 2/2.0 | 1,820 (+10%) | 3mo | $312,000 | $171 | 48 |
| 1202 Nahm Dr | 0.68mi | 3/1.5 (+1) | 1,741 (+5%) | 8mo | $250,000 | $144 | 46 |
| 846 E 10th Ave | 0.51mi | 3/1.5 (+1) | 1,888 (+14%) | 12mo | $249,000 | $132 | 36 |
| 923 Barber Way | 0.74mi | 3/2.0 (+1) | 1,504 (-9%) | 11mo | $205,000 | $136 | 32 |
| 1206 Nahm Dr | 0.70mi | 3/2.0 (+1) | 1,474 (-11%) | 11mo | $295,000 | $200 | 31 |
| 1330 Clay St | 0.60mi | 2/1.0 | 1,422 (-14%) | 22mo | $127,500 | $90 | 30 |
| 552 Stanford Ave | 0.68mi | 3/2.0 (+1) | 1,430 (-14%) | 11mo | $223,991 | $157 | 28 |
Match score weights: distance 35% · size 25% · config 20% · recency 20%. Top-matched comps best support the ARV.
Projected returns pro-forma
-3.0% appreciation · 0.28% rent growth · sell at horizon
- IRR
- -16.4%
- Equity multiple
- 0.43×
- Total profit
- $-27,838
- Equity at exit
- $26,078
- IRR
- -13.1%
- Equity multiple
- 0.32×
- Total profit
- $-33,464
- Equity at exit
- $15,122
Cash invested: $48,972 (down + closing). Projections, not guarantees.
Landlord ↔ Tenant lean methodology
- Overall (STATE)
- 83 Strongly Landlord-Friendly
- State Kentucky
- 83 Strongly Landlord-Friendly · R+16
- County
- — inherits STATE
- City
- — inherits STATE
ZIP-level market 42101
- Home prices YoY
- -20.9%
- Rents YoY
- 0.3%
- Active inventory
- 591
- Price-to-rent
- 10.5×
Monthly cashflow live
- Estimated rent
- $1,391 high interval (Pro) →
- Mortgage (P&I)
- −$917
- Tax from tax record
- −$41 /mo · $492/yr
- Insurance
- −$73
- HOA
- −$0
- Vacancy / Maint / Mgmt
- −$292
- Net cashflow
- $67
Break-even live
UW: 25.0% down · 7.5% · 30yr · 1.5% tax · 5.0% vac · 8.0% maint · 8.0% mgmt
Financing live
Cash to close
- Down payment
- $43,725
- Closing costs
- $5,247
- Reserves months
- —
- Total cash needed
- —
Loan-product check · same deal, 3 products live
Conventional
25% down · 7.5% · 30yr
- Down + closing
- —
- Monthly P&I
- —
- Monthly cashflow
- —
- DSCR
- —
- Eligible?
- —
Personal DTI + credit; lowest rate.
DSCR
20% down · 8.5% · 30yr
- Down + closing
- —
- Monthly P&I
- —
- Monthly cashflow
- —
- DSCR
- —
- Eligible?
- —
No personal income docs; deal must DSCR.
Hard money
10% down · 12.0% · 12mo
- Down + closing
- —
- Monthly P&I
- —
- Monthly cashflow
- —
- DSCR
- —
- Eligible?
- —
Short-term bridge; refi at stabilization.
Rent comps 11 comps
| Address | Beds | Baths | Sqft | Rent | $/sqft | DOM | Units | Dist |
|---|---|---|---|---|---|---|---|---|
| 1453 Park St Unit A Bowling Green, KY | 2.0 | 2.5 | 1250 | $1,125 | $0.90 | 21d | 1 | 0.13mi |
| 1117 Greenwood Aly Bowling Green, KY | 3.0 | 2.0 | 1100 | $2,200 | $2.00 | 13d | 2 | 0.45mi |
| 516 Regents Ave Bowling Green, KY | 2.0 | 2.0 | 1481 | $1,500 | $1.01 | 13d | 1 | 0.59mi |
| 1207 Smallhouse Rd Bowling Green, KY | 2.0 | 1.5 | 1202 | $1,100 | $0.92 | 21d | 1 | 0.62mi |
| 1233 Henry Dr Bowling Green, KY | 3.0 | 1.0 | 1107 | $1,250 | $1.13 | 13d | 1 | 0.75mi |
| 1706 Kirby Dr Bowling Green, KY | 3.0 | 1.0 | 1227 | $1,350 | $1.10 | 13d | 1 | 0.80mi |
| 864 Fairview Ave Unit D03 Bowling Green, KY | 2.0 | 2.5 | 1500 | $1,525 | $1.02 | 21d | 1 | 0.92mi |
| 701 Magnolia St Bowling Green, KY | 3.0 | 1.5 | 1502 | $1,700 | $1.13 | 21d | 1 | 1.03mi |
| 604 Eastwood St Bowling Green, KY | 2.0 | 1.5 | 1100 | $1,075 | $0.98 | 13d | 1 | 1.17mi |
| 1131 Fairview Ave Bowling Green, KY | 2.0 | 2.0 | 1623 | $2,800 | $1.73 | 21d | 1 | 1.31mi |
| 1225 N Lee Dr Bowling Green, KY | 3.0 | 2.5 | 1200 | $1,345 | $1.12 | 43d | 1 | 1.46mi |
Listing history 9 events
-
2026-06-19days on market $174,900 Active 11 DOM
-
2026-06-18days on market $174,900 Active 10 DOM
-
2026-06-17days on market $174,900 Active 9 DOM
-
2026-06-16days on market $174,900 Active 8 DOM
-
2026-06-15days on market $174,900 Active 7 DOM
-
2026-06-14days on market $174,900 Active 5 DOM
-
2026-06-13days on market $174,900 Active 4 DOM
-
2026-06-10days on market $174,900 Active 2 DOM
-
2026-06-09$174,900 Active 1 DOM
ⓘ Source: listings_history table (triggers on properties + properties_extension) + one-shot
backfill from property_details.listing_events for pre-trigger history.
Tax reassessment forecast KY · Resets to sale price
- Current annual tax
- $492 · $41/mo
- Projected year-2 tax
- $1,504 · $125/mo
- Expected delta
- +$1,012/yr (+$84/mo · 205.5%)
ⓘ Screening estimate from a state-policy table — verify with the county assessor before closing.
Climate risk First Street
- Flood 1/10 Low FEMA zone X (unshaded) · 0% chance over 30 yrs
- Wildfire 1/10 Low
- Heat 5/10 Major 7 d/yr ≥107°F today · 19 d/yr by 30 yrs out
- Wind 2/10 Low 5% chance of damaging wind over 30 yrs
- Air quality 2/10 Low 0 unhealthy d/yr today · 1 by 30 yrs out
Nearby sold comps map
Loading sold comps map…
Walkable amenities ~0.75 mi
Loading nearby amenities…
Taxation est. · year 1
- Rental income
- $16,687
- − Mortgage interest
- −$9,797
- − Property taxes
- −$492
- − Insurance
- −$874
- − Repairs & maintenance
- −$1,335
- − Management
- −$1,335
- − Depreciation
- −$5,088
- Taxable loss
- −$2,235
- Est. tax savings @ 24.0%
- +$536
- After-tax cash flow
- $1,346/yr
For passive investors: Depreciation is non-cash, so a rental often shows a tax loss while cash-flowing — sheltering income. Rental losses are passive: they offset passive income freely, and up to $25,000/yr can offset ordinary (W-2) income if you actively participate and your MAGI is under $100k (phasing out to $0 by $150k); unused losses carry forward. On sale, claimed depreciation is recaptured at up to 25%, and gains may owe capital-gains tax (a 1031 exchange can defer both). Figures are a year-1 estimate at your 24.0% rate — not tax advice; consult a CPA.
Schools (NCES district)
- District
- Bowling Green Independent
- NCES district ID
- 2100570
- Math proficiency
- 37% ▼ -11.00%
- Reading proficiency
- 41% ▼ -15.00%
- Median HH income
- $31,181
- Composite
- 31.86/100
- National rank
- #5870
- State rank
- #44 of 165 in KY
Livability — Bowling Green
- Score
- 65/100
- State rank
- #255
- US rank
- #12782
Category grades
Schools grade is shown separately in the Schools card above.
Census & demographics
- Census place
- Bowling Green, KY
- County
- Warren County · 129,408 people
- City population
- 129,408
- Metro
- Bowling Green, KY
- Population (ZIP)
- 65,421
- Household income
- $48,217
- Rent vs Own
- Severe rent burden
- 3855.0
Population outlook (Warren County) Hauer SSP2
- Today (2025)
- 144,620 people
- By 2030
- 155,977 · +7.9%
- By 2040
- 179,381 · +24.0%
- By 2050
- 203,713 · +40.9%
- By 2075
- 267,291 · +84.8%
- By 2100
- 314,019 · +117.1%
Race, ethnicity, and origin ACS 2023
- Neighborhood character
- Predominantly White (68%)
- Race & ethnicity
- White 68% Black 13% Hispanic / Latino 10% Two or more races 7% Asian 3%
- Hispanic origin (detail)
- Mexican 6%
- Common ancestry
- Slovak 2% American 1% Italian 1%
- Foreign-born
- 10% · Canada, Philippines
- Languages at home
- 84% English-only · Spanish 8% Other Asian/Pacific 2% Russian/Polish/Slavic 2%
Political lean MEDSL · Warren
- 2024 margin
- Strong R (+24.3) · D 37.0% · R 61.3% · Other 1.6%
- 2008→2024 swing
- -5.4pp toward R · 2008: -18.9pp · 2024: -24.3pp
- All cycles
- 2024: R+24.3 2020: R+16.8 2016: R+24.2 2012: R+21.8 2008: R+18.9
Not yet ingested
- Civics
- —
Market trends
- HPI YoY
- ▼ -73.34%
- Current HPI
- 277.6554
- Rent YoY
- ▲ 0.28%
- Metro
- Bowling Green, KY
- State GDP YoY
- ▲ 1.81%
- F500 in state
- 4
Industry mix (Fortune 500 HQ in KY)
| Industry | F500 HQs | Revenue |
|---|---|---|
| Healthcare | 1 | $118B |
|
||
| Food / Beverage | 1 | $7B |
|
||
Price history
+16.7% since first listed13 events — show timeline
- 2026-06-05 Listed $174,900 RASKMLS
- 2026-04-17 Price Changed $189,900 RASKMLS
- 2026-04-06 Price Changed $192,900 RASKMLS
- 2026-03-20 Price Changed $193,900 RASKMLS
- 2026-03-02 Price Changed $196,900 RASKMLS
- 2026-01-13 Price Changed $199,900 RASKMLS
- 2025-12-22 Price Changed $219,900 RASKMLS
- 2025-05-02 Listed $235,000 RASKMLS
- 2024-03-29 Price Changed $219,000 RASKMLS
- 2024-01-24 Listed $220,000 RASKMLS
- 2023-08-28 Listed $220,000 RASKMLS
- 2019-10-21 Sold (MLS) $140,000 RASKMLS
- 2019-05-20 Listed $149,900 RASKMLS
Property tax history
+6.9%/yrLatest (2025): $492 · +7.0% YoY. Source: county tax records.
Cash-flow waterfall
monthlySold comps — $/sqft
last 12 mo · ≤1 miLoading sold comps…