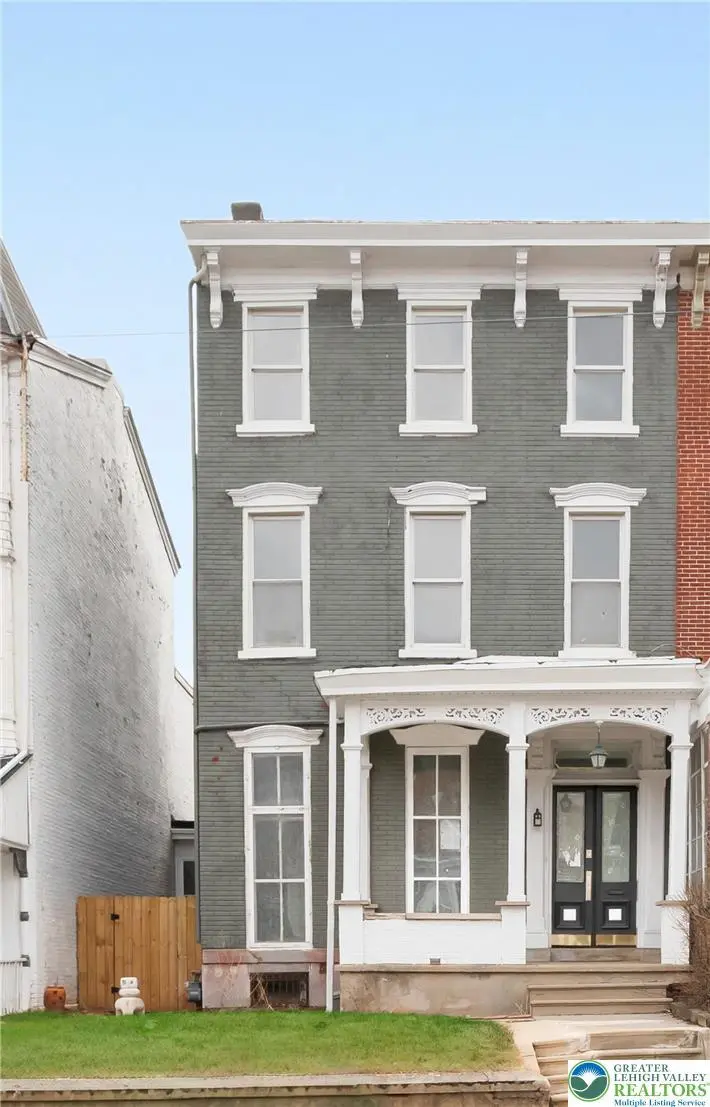
315 N 6th St
Allentown, PA 18102
$430,000C+
4 bd · 3.0 ba ·
2,976 sqft ·
Built 1865
· MultiFamily
· Pending
· 3 DOM
Cashflow @ list (25.0% down · 7.5%)
Estimated rent
$5,516/mo
Mortgage (P&I)
−$2,255
Tax + insurance
−$493
HOA
−$0
Vac / Maint / Mgmt
−$1,158
Net cashflow
$1,609/mo
Annual
$19,312/yr
Cap rate
10.78%
Cash-on-cash
16.04%
DSCR
1.71
1% rule
1.28%
Cash to close
$120,400
Investor read
- This is a 4-bed/3.0-bath multifamily listed at $430k.
- At list price, monthly cash flow is $2k ($19k/yr) — positive.
- The deal already cash-flows at list — no discount required.
- Meets the 1% rule at list price ($6k rent vs $430k).
- Only 3 days on market — expect competitive offers; lowballing is unlikely to land.
- Local home prices are declining (-3.0%/yr); year-one equity from $3k of loan paydown is wiped out by about $13k of value loss. Plan a longer hold.
- Location reads 81/100 on livability (#171 in PA, #1,440 nationally) — a professional / high-income tenant draw. Strengths: commute A+, cost of living A+, housing A+; Watch: employment D.
- Allentown City SD (urban): math 10% / reading 20% proficiency, ranked #513 of 539 in PA (top 95%) — low school quality limits family demand, transient renter base, plan for 1-2y turnover; 73% free/reduced lunch — lower-income household profile, screen leases tightly.
- Zoned schools: Central El Sch (math 2% / reading 24%, grade F, #1,354 of 1,518 statewide, top 89%, 662 students, 100% FRL); Francis D Raub Ms (math 2% / reading 24%, grade F, #484 of 512 statewide, top 95%, 909 students, 100% FRL); William Allen Hs (math 29% / reading 10%, grade F, #392 of 437 statewide, top 90%, 2,852 students, 87% FRL) — zoned schools average 96% FRL vs 73% district-wide (23 pts higher); higher-poverty schools than district average — tighter screening recommended.
- Watch-outs: built in 1865 — expect roof / HVAC / electrical / plumbing capex.
- Market conditions: Rents rising fast (+5.5%/yr); 170 active listings in the ZIP; 9 comparable units currently listed for rent nearby; rentals at typical pace (median 24d on market — plan ~3-4 weeks tenant-placement turnaround); 44% of comp listings sitting > 30 days — soft ceiling on asking rent; lower-income renter base — watch delinquency; 765 units permitted in Lehigh County in 2024 (286 in 5+ unit buildings).
- Lehigh County population projected at +21% by 2050 — long-run rental-demand tailwind backs the buy-and-hold thesis.
- 3 sale attempts since 2y ago with the ask held roughly flat each time — persistent listings suggest the price (not the market) is what's stuck; bring a comps-based counter.
- Current owner paid $215k; list at $430k implies a 100% gain — meaningful room to come down on a strong offer.
- At projected returns (-3.0% appreciation + 5.5% rent growth), your $120k cash investment doubles in ~7 years — after that, you're playing with house money.
- Climate carrying-cost: extreme-heat days projected 7→15/yr by 2055 (HVAC capex compounding) — expect insurance premiums to compound above CPI over the hold.
- Cap rate 10.8% vs local median 5.3% in Allentown — top-decile yield for the area; either an underpriced asset or a hidden risk that comps aren't pricing in. Stress-test before assuming the spread holds.
- At $5,516/mo this rent would consume 154% of the median local household income ($43k/yr) (locally 4313% of renters already pay >50% of income on rent) — very limited rent-growth headroom before tenants either downsize or default.
Questions for listing agent
- Built in 1865 — when were the roof, HVAC, electrical panel, plumbing, and water heater last replaced?
- Is there a deadline driving the sale (1031 exchange, divorce, estate, relocation)? That informs how much negotiation room exists.
- Schools are D-rated, which usually means shorter tenancies and higher turnover. Who's the typical renter profile here, and what's been the actual vacancy rate?
- What's the average days-on-market for RENTAL listings here right now (not sales)? A rising rental-DOM trend means longer vacancies and softer asking-rent achievability than the comps imply.
- What's the recent tenant-quality profile in this submarket — average credit score on applications, eviction rate, late-payment / NSF rate, and stable-employment percentage? A property-management company in the area should have these aggregated.
- How much new apartment / multifamily construction is in the pipeline within 1–3 miles? Heavy new supply (>2% of stock underway) typically softens rents 12–24 months out; light construction supports rent growth.
CashFlowRE · CFR-H6ZEHQ48J1P888
· Data 1 week ago
cashflowre.app · 2026-05-29