 Multi-family
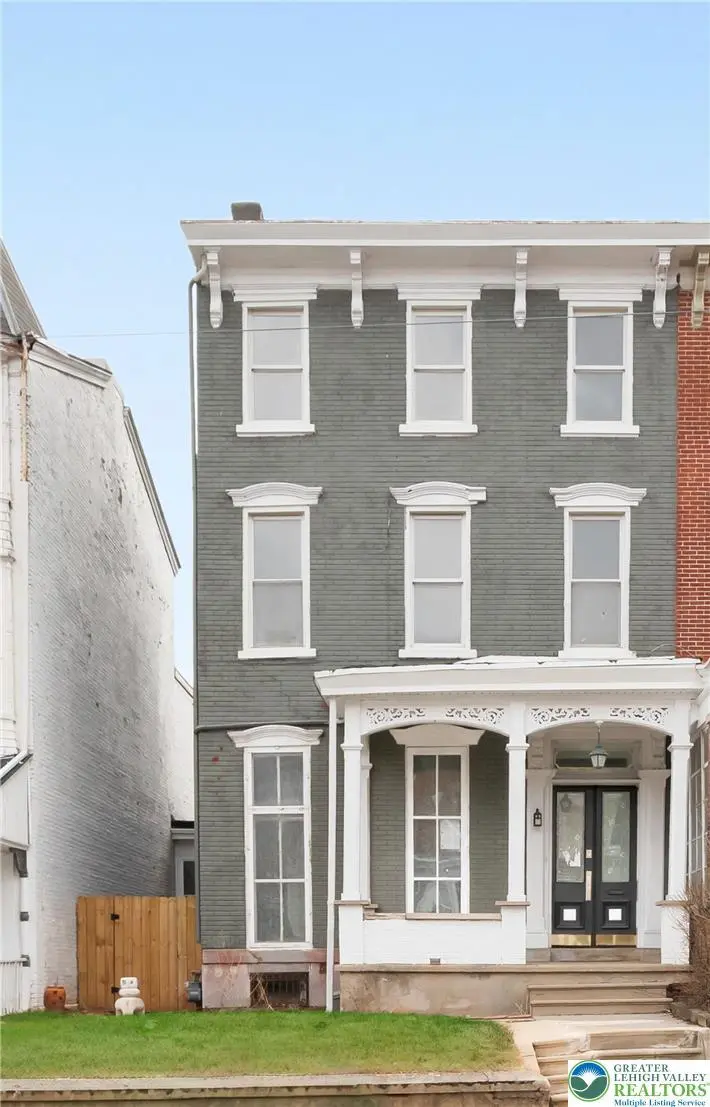
315 N 6th St · Allentown, PA
Flood risk 1/10 · Minimal
- FEMA flood zone
- X (unshaded)
- Chance of flooding over 30 yrs
- 0.0%
- Est. flood insurance / yr
- $473 – $860
Fire risk 1/10 · Minimal
- Est. fire insurance / yr
- $511 – $949
Heat risk 5/10 · Moderate
- Hot days now (above 99°F)
- 7 days/yr
- Hot days in 30 yrs
- 15 days/yr
Wind risk 4/10 · Minor
- Chance of severe wind over 30 yrs
- 15.0%
Air-quality risk 3/10 · Minor
- Unhealthy air days now
- 3 days/yr
- Unhealthy air days in 30 yrs
- 4 days/yr
Risk factors via First Street. Map © Google.
Why this score? — see what drove the C+ grade
The composite is a weighted blend of 9 inputs, each scored 0–100. Each bar is that input's sub-score; the figure is the points it added to the 100-point composite (weight × sub-score).
- Cash flow +30.0/30.0
- DSCR +10.0/10.0
- 1% rule +7.8/10.0
- Livability +4.0/5.0
- Rent growth +3.9/5.0
- ARV discount +3.2/15.0
- Condition / age +2.5/5.0
- Schools +1.2/10.0
- Appreciation +0.0/10.0
$430,000
🖨 Deal sheet (PDF) 📄 Offer letter ✓ Due diligence
Multi-family units
County records classify this as Multi-Family (2-4 Unit). Listing-text estimate: 1 unit. estimate disagrees with records
Listing remarks
This stunning, renovated 3-unit multi-family home offers nearly 3,000 square feet of modern living space with high ceilings and exceptional quality throughout. With a potential of $51,600 in rental income or more, the building features 3 units and a large 3 car garage with extra storage above 2 bays. Completely updated from top to bottom, this property is move-in ready and ideal for both savvy investors seeking strong rental income or an owner-occupant looking to live in one unit while renting out the others. Each tenant has their own brand new electric panel in their unit, and their own thermostat for comfort. Property will be sold with clear CO from City of Allentown. Owner is PA licensed
Key facts
- 3 parking spots
- Built 1865
- Listed 3 days
Property features AI
Finance
- Other: No additional financial details provided
- Financial info: Operating expense: $18,596; Maintenance expense: $1,476; Professional management expense: $3,936; Water/sewer expense: $1,620; Electric expense: $360; Insurance expense: $1,600; Unit rents (actual): Unit 1 (Large 3-bed) $1,850; Unit 2 (Studio) $900; Unit 3 (1-bed) $1,150
- HOA & community: No HOA information provided
Exterior
- Parking: Three parking spaces (total)
- Security: No security information provided
- Utilities: Public water; Public sewer
- Home design: Multi-family property
- Construction: Brick construction; Year built unknown
- Exterior features: Zoned R-Mh (Medium High Density)
Interior
- Kitchen: No kitchen appliance details provided
- Bedrooms: One-bedroom apartment (Unit 3); Studio apartment (listed as 1 bedroom for Unit 2); Large 3-bedroom (Unit 1; possibly 4)
- Flooring: No flooring information provided
- Bathrooms: Three full bathrooms; One half bathroom
- Heating & cooling: Heating present: baseboard heating with gas hot water; Cooling via wall/window units
- Interior features: Three total dwelling units (multi-family)
- Laundry & utility: No laundry appliance details provided
Neighborhood map
What this means for you Summary
Snapshot
- This is a 4-bed/3.0-bath multifamily listed at $430k.
Deal economics
- At list price, monthly cash flow is $2k ($19k/yr) — positive.
- The deal already cash-flows at list — no discount required.
- Meets the 1% rule at list price ($6k rent vs $430k).
- Cap rate 10.8% vs local median 5.3% in Allentown — top-decile yield for the area; either an underpriced asset or a hidden risk that comps aren't pricing in. Stress-test before assuming the spread holds.
Location & tenants
- Location reads 81/100 on livability (#171 in PA, #1,440 nationally) — a professional / high-income tenant draw. Strengths: commute A+, cost of living A+, housing A+; Watch: employment D.
- Allentown City SD (urban): math 10% / reading 20% proficiency, ranked #513 of 539 in PA (top 95%) — low school quality limits family demand, transient renter base, plan for 1-2y turnover; 73% free/reduced lunch — lower-income household profile, screen leases tightly.
- Zoned schools: Central El Sch (math 2% / reading 24%, grade F, #1,354 of 1,518 statewide, top 89%, 662 students, 100% FRL); Francis D Raub Ms (math 2% / reading 24%, grade F, #484 of 512 statewide, top 95%, 909 students, 100% FRL); William Allen Hs (math 29% / reading 10%, grade F, #392 of 437 statewide, top 90%, 2,852 students, 87% FRL) — zoned schools average 96% FRL vs 73% district-wide (23 pts higher); higher-poverty schools than district average — tighter screening recommended.
- Market conditions: Rents rising fast (+5.5%/yr); 170 active listings in the ZIP; 9 comparable units currently listed for rent nearby; rentals at typical pace (median 23d on market — plan ~3-4 weeks tenant-placement turnaround); 44% of comp listings sitting > 30 days — soft ceiling on asking rent; lower-income renter base — watch delinquency; 765 units permitted in Lehigh County in 2024 (286 in 5+ unit buildings).
- At $5,516/mo this rent would consume 154% of the median local household income ($43k/yr) (locally 4313% of renters already pay >50% of income on rent) — very limited rent-growth headroom before tenants either downsize or default.
Forward outlook
- Local home prices are declining (-3.0%/yr); year-one equity from $3k of loan paydown is wiped out by about $13k of value loss. Plan a longer hold.
- Lehigh County population projected at +21% by 2050 — long-run rental-demand tailwind backs the buy-and-hold thesis.
- At projected returns (-3.0% appreciation + 5.5% rent growth), your $120k cash investment doubles in ~7 years — after that, you're playing with house money.
Negotiation context
- Only 3 days on market — expect competitive offers; lowballing is unlikely to land.
- 3 sale attempts since 2y ago with the ask held roughly flat each time — persistent listings suggest the price (not the market) is what's stuck; bring a comps-based counter.
- Current owner paid $215k; list at $430k implies a 100% gain — meaningful room to come down on a strong offer.
Risks & watch-outs
- Watch-outs: built in 1865 — expect roof / HVAC / electrical / plumbing capex.
- Climate carrying-cost: extreme-heat days projected 7→15/yr by 2055 (HVAC capex compounding) — expect insurance premiums to compound above CPI over the hold.
Questions for the listing agent
- Built in 1865 — when were the roof, HVAC, electrical panel, plumbing, and water heater last replaced?
- Is there a deadline driving the sale (1031 exchange, divorce, estate, relocation)? That informs how much negotiation room exists.
- Schools are D-rated, which usually means shorter tenancies and higher turnover. Who's the typical renter profile here, and what's been the actual vacancy rate?
- What's the average days-on-market for RENTAL listings here right now (not sales)? A rising rental-DOM trend means longer vacancies and softer asking-rent achievability than the comps imply.
- What's the recent tenant-quality profile in this submarket — average credit score on applications, eviction rate, late-payment / NSF rate, and stable-employment percentage? A property-management company in the area should have these aggregated.
- How much new apartment / multifamily construction is in the pipeline within 1–3 miles? Heavy new supply (>2% of stock underway) typically softens rents 12–24 months out; light construction supports rent growth.
Investment metrics
- 1% rule
- 1.28% ✓
- Cap rate
- 10.78%
- Cash-on-cash
- 16.04%
- DSCR
- 1.71
- GRM
- 6.5
CMA / ARV
- ARV (on-the-fly)
- $392,832
- Comps found
- 6
Show comp detail 6 sales within ~0.75 mi
| Address | Dist | Beds/Ba | Sqft | Sold | Price | $/sf | Match |
|---|---|---|---|---|---|---|---|
| 441 W Turner St | 0.19mi | 5/3.0 (+1) | 3,035 (+2%) | 13mo | $385,000 | $127 | 72 |
| 537 W Liberty St | 0.17mi | 4/3.0 | 2,584 (-13%) | 24mo | $385,000 | $149 | 50 |
| 1101 W Turner St | 0.60mi | 5/3.0 (+1) | 2,964 (-0%) | 21mo | $399,900 | $135 | 49 |
| 45 N 11th St | 0.61mi | 5/— (+1) | 3,190 (+7%) | 12mo | $420,000 | $132 | 44 |
| 338 N 2nd | 0.53mi | 5/3.0 (+1) | 2,600 (-13%) | 20mo | $295,000 | $113 | 33 |
| 117 N Poplar St | 0.64mi | 4/1.0 | 3,408 (+14%) | 23mo | $140,000 | $41 | 19 |
Match score weights: distance 35% · size 25% · config 20% · recency 20%. Top-matched comps best support the ARV.
Projected returns pro-forma
-3.0% appreciation · 5.48% rent growth · sell at horizon
- IRR
- 9.6%
- Equity multiple
- 1.39×
- Total profit
- $46,873
- Equity at exit
- $64,114
- IRR
- 20.6%
- Equity multiple
- 2.94×
- Total profit
- $233,480
- Equity at exit
- $37,179
Cash invested: $120,400 (down + closing). Projections, not guarantees.
Landlord ↔ Tenant lean methodology
- Overall (STATE)
- 62 Landlord-Friendly
- State Pennsylvania
- 62 Landlord-Friendly · EVEN
- County
- — inherits STATE
- City
- — inherits STATE
ZIP-level market 18102
- Rents YoY
- 5.5%
- Active inventory
- 170
- Price-to-rent
- 19.5×
Monthly cashflow live
- Estimated rent
- $5,516 high interval (Pro) →
- Mortgage (P&I)
- −$2,255
- Tax from tax record
- −$314 /mo · $3,770/yr
- Insurance
- −$179
- HOA
- −$0
- Vacancy / Maint / Mgmt
- −$1,158
- Net cashflow
- $1,609
Break-even live
Sensitivity live
| Price | -10% $1,853 | -5% $1,731 | +0% $1,609 | +5% $1,488 | +10% $1,366 |
|---|---|---|---|---|---|
| Rent | -10% $1,174 | -5% $1,391 | +0% $1,609 | +5% $1,827 | +10% $2,045 |
| Rate | -1.0pp $1,826 | -0.5pp $1,719 | base $1,609 | +0.5pp $1,498 | +1.0pp $1,385 |
3-unit breakdown (identical units grouped — click to expand)
| Units | Beds | Baths | Est. rent |
|---|---|---|---|
| 3× units | 3 | 1.5 | $5,517 |
| #1 | 3 | 1.5 | $1,839 |
| #2 | 3 | 1.5 | $1,839 |
| #3 | 3 | 1.5 | $1,839 |
| Total (3 units) | $5,516 | ||
UW: 25.0% down · 7.5% · 30yr · 1.5% tax · 5.0% vac · 8.0% maint · 8.0% mgmt
Financing live
Cash to close
- Down payment
- $107,500
- Closing costs
- $12,900
- Reserves months
- —
- Total cash needed
- —
Loan-product check · same deal, 3 products live
Conventional
25% down · 7.5% · 30yr
- Down + closing
- —
- Monthly P&I
- —
- Monthly cashflow
- —
- DSCR
- —
- Eligible?
- —
Personal DTI + credit; lowest rate.
DSCR
20% down · 8.5% · 30yr
- Down + closing
- —
- Monthly P&I
- —
- Monthly cashflow
- —
- DSCR
- —
- Eligible?
- —
No personal income docs; deal must DSCR.
Hard money
10% down · 12.0% · 12mo
- Down + closing
- —
- Monthly P&I
- —
- Monthly cashflow
- —
- DSCR
- —
- Eligible?
- —
Short-term bridge; refi at stabilization.
Rent comps 9 comps
| Address | Beds | Baths | Sqft | Rent | $/sqft | DOM | Units | Dist |
|---|---|---|---|---|---|---|---|---|
| 528 N 6th St Allentown, PA | 3.0 | 1.0 | 1934 | $1,800 | $0.93 | 45d | 1 | 0.18mi |
| 389 W Turner St Allentown, PA | 4.0 | 1.5 | 2144 | $2,400 | $1.12 | 4d | 1 | 0.33mi |
| 406 N 2nd St Allentown, PA | 3.0 | 2.0 | 2400 | $1,700 | $0.71 | 45d | 1 | 0.54mi |
| 948 W Maple St Allentown, PA | 4.0 | 1.0 | 1932 | $2,300 | $1.19 | 45d | 1 | 0.62mi |
| 1315 Chew St Allentown, PA | 5.0 | 2.5 | 2811 | $2,850 | $1.01 | 45d | 1 | 0.84mi |
| 36 S Jefferson St Allentown, PA | 5.0 | 1.5 | 2128 | $2,500 | $1.17 | 16d | 1 | 0.88mi |
| 1341 Chew St Allentown, PA | 5.0 | 1.5 | 2139 | $2,500 | $1.17 | 23d | 1 | 0.89mi |
| 138 S 14th St Allentown, PA | 5.0 | 1.0 | 2300 | $2,300 | $1.00 | 16d | 1 | 1.08mi |
| 1229 Pericles Pl Whitehall, PA | 1.0–3.0 | 1.0–2.0 | 1574 | $2,750 | $1.75 | 4d | 7 | 1.42mi |
Listing history 10 events
-
2026-05-09status Pending
-
2026-05-08status Active
-
2026-05-08price $430,000
-
2026-03-30status Pending
-
2026-03-30price $440,000
-
2026-03-28$430,000 Active
-
2024-12-24soldstatus $215,000
-
2024-12-20soldstatus $215,000 Sold
-
2024-12-09$215,000
-
1998-10-02soldstatus $46,900
ⓘ Source: listings_history table (triggers on properties + properties_extension) + one-shot
backfill from property_details.listing_events for pre-trigger history.
Tax reassessment forecast PA · Partial reset (capped growth)
- Current annual tax
- $3,770 · $314/mo
- Projected year-2 tax
- $5,282 · $440/mo
- Expected delta
- +$1,512/yr (+$126/mo · 40.1%)
ⓘ Screening estimate from a state-policy table — verify with the county assessor before closing.
Climate risk First Street
- Flood 1/10 Low FEMA zone X (unshaded) · 0% chance over 30 yrs
- Wildfire 1/10 Low
- Heat 5/10 Major 7 d/yr ≥99°F today · 15 d/yr by 30 yrs out
- Wind 4/10 Moderate 15% chance of damaging wind over 30 yrs
- Air quality 3/10 Moderate 3 unhealthy d/yr today · 4 by 30 yrs out
Nearby sold comps map
Loading sold comps map…
Walkable amenities ~0.75 mi
Loading nearby amenities…
Taxation est. · year 1
- Rental income
- $66,192
- − Mortgage interest
- −$24,087
- − Property taxes
- −$3,770
- − Insurance
- −$2,150
- − Repairs & maintenance
- −$5,295
- − Management
- −$5,295
- − Depreciation
- −$12,509
- Taxable income
- $13,086
- Est. tax owed @ 24.0%
- −$3,141
- After-tax cash flow
- $16,172/yr
For passive investors: Depreciation is non-cash, so a rental often shows a tax loss while cash-flowing — sheltering income. Rental losses are passive: they offset passive income freely, and up to $25,000/yr can offset ordinary (W-2) income if you actively participate and your MAGI is under $100k (phasing out to $0 by $150k); unused losses carry forward. On sale, claimed depreciation is recaptured at up to 25%, and gains may owe capital-gains tax (a 1031 exchange can defer both). Figures are a year-1 estimate at your 24.0% rate — not tax advice; consult a CPA.
Schools (NCES district)
- District
- Allentown City SD
- NCES district ID
- 4202280
- Math proficiency
- 10% ▼ -10.00%
- Reading proficiency
- 20% ▼ -15.00%
- Median HH income
- $36,337
- Composite
- 12.43/100
- National rank
- #9630
- State rank
- #513 of 539 in PA
Livability — Allentown
- Score
- 81/100
- State rank
- #171
- US rank
- #1440
Category grades
Schools grade is shown separately in the Schools card above.
Census & demographics
- Census place
- Allentown, PA
- County
- Lehigh County · 333,019 people
- City population
- 172,996
- Metro
- Allentown-Bethlehem-Easton, PA-NJ
- Population (ZIP)
- 51,001
- Household income
- $43,085
- Rent vs Own
- Severe rent burden
- 4313.0
Population outlook (Lehigh County) Hauer SSP2
- Today (2025)
- 392,957 people
- By 2030
- 408,319 · +3.9%
- By 2040
- 440,007 · +12.0%
- By 2050
- 475,940 · +21.1%
- By 2075
- 590,448 · +50.3%
- By 2100
- 690,314 · +75.7%
Race, ethnicity, and origin ACS 2023
- Neighborhood character
- Predominantly Hispanic (69%)
- Race & ethnicity
- Hispanic / Latino 69% Two or more races 28% White 18% Black 10%
- Hispanic origin (detail)
- Mexican 3% Puerto Rican 38% Dominican 22%
- Common ancestry
- Polish 1% Romanian 1% Hispanic 1%
- Foreign-born
- 22% · Canada, Jamaica
- Languages at home
- 45% English-only · Spanish 52% Arabic 2%
Political lean MEDSL · Lehigh
- 2024 margin
- Toss-up / Even · D 50.7% · R 48.0% · Other 1.2%
- 2008→2024 swing
- -12.9pp toward R · 2008: 15.6pp · 2024: 2.7pp
- All cycles
- 2024: D+2.7 2020: D+7.6 2016: D+4.4 2012: D+7.5 2008: D+15.6
Not yet ingested
- Civics
- —
Market trends
- HPI YoY
- ▼ -227.01%
- Current HPI
- 404.834
- Rent YoY
- ▲ 5.48%
- Metro
- Allentown-Bethlehem-Easton, PA-NJ
- State GDP YoY
- ▲ 1.68%
- F500 in state
- 34
Industry mix (Fortune 500 HQ in PA)
| Industry | F500 HQs | Revenue |
|---|---|---|
| Healthcare | 2 | $309B |
|
||
| Insurance | 2 | $27B |
|
||
| Telecommunications / Media | 1 | $124B |
|
||
| Industrial Distribution | 1 | $22B |
|
||
| Financial Services | 1 | $20B |
|
||
| Chemicals / Materials | 1 | $18B |
|
||
Price history
+816.8% since first listed10 events — show timeline
- 2026-05-09 Pending — GLVRMLS
- 2026-05-08 Relisted — GLVRMLS
- 2026-05-08 Price Changed $430,000 GLVRMLS
- 2026-03-30 Pending — GLVRMLS
- 2026-03-30 Price Changed $440,000 GLVRMLS
- 2026-03-28 Listed $430,000 GLVRMLS
- 2024-12-24 Sold (Public Records) $215,000 Public Records
- 2024-12-20 Sold (MLS) $215,000 GLVRMLS
- 2024-12-09 Listed $215,000 GLVRMLS
- 1998-10-02 Sold (Public Records) $46,900 Public Records
Property tax history
-1.6%/yrLatest (2026): $3,770 · +0.9% YoY. Source: county tax records.
Cash-flow waterfall
monthlySold comps — $/sqft
last 12 mo · ≤1 miLoading sold comps…