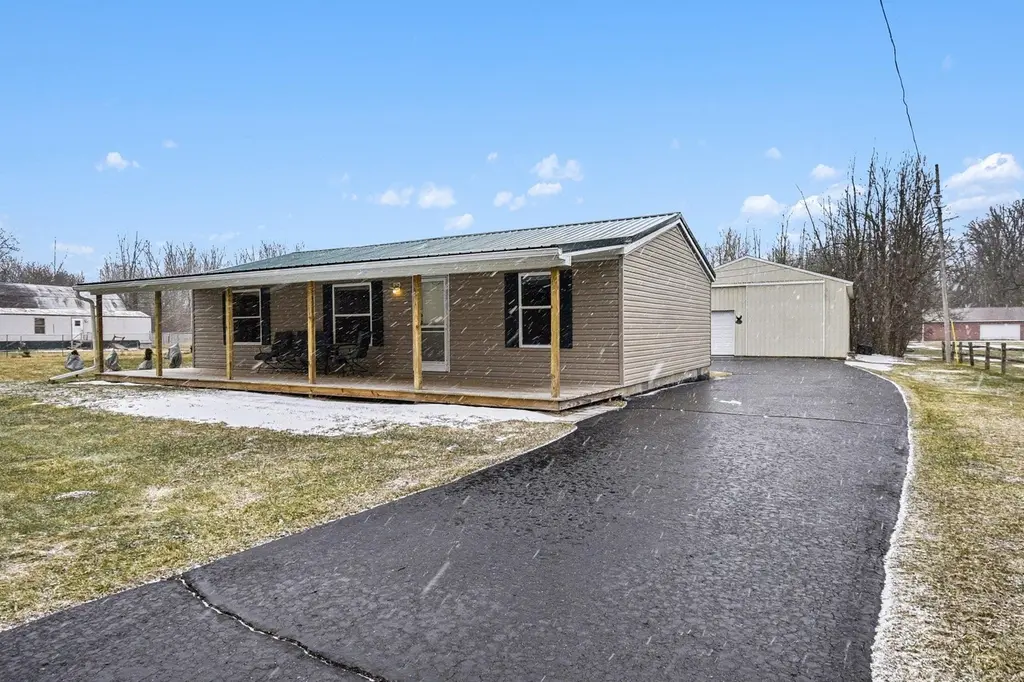
1526 E Miller Rd
Midland, MI 48640
$178,900D
3 bd · 1.0 ba ·
920 sqft ·
Built 1997
· SingleFamily
· Pending
· 4 DOM
Cashflow @ list (25.0% down · 7.5%)
Estimated rent
$1,469/mo
Mortgage (P&I)
−$938
Tax + insurance
−$249
HOA
−$0
Vac / Maint / Mgmt
−$309
Net cashflow
$-27/mo
Annual
$-323/yr
Cap rate
6.11%
Cash-on-cash
-0.65%
DSCR
0.97
1% rule
0.82%
Cash to close
$50,092
Investor read
- This is a 3-bed/1.0-bath single-family listed at $179k.
- At list price, monthly cash flow is $-27 ($-323/yr) — negative.
- To cash-flow at today's rent, offer at most $174k (2.7% below list).
- To meet the 1% rule (rent ≥ 1% of price), the offer needs to be $147k (17.9% below list).
- Only 4 days on market — expect competitive offers; lowballing is unlikely to land.
- Recommended offer: $147k (17.9% below list) — sets the bar for 1% rule.
- Local home prices are declining (-3.0%/yr); year-one equity from $1k of loan paydown is wiped out by about $5k of value loss. Plan a longer hold.
- Location reads 85/100 on livability (#28 in MI, #578 nationally) — a professional / high-income tenant draw. Strengths: crime A+, cost of living A+, housing A+; Watch: commute F.
- Bullock Creek School District (rural): math 37% / reading 55% proficiency, ranked #132 of 540 in MI (top 24%) — families likely to look elsewhere, expect single-tenant / working-renter base with shorter leases.
- Zoned schools: Floyd School (math 52% / reading 47%, grade D, #382 of 1,397 statewide, top 30%, 307 students, 66% FRL); Bullock Creek Middle School (math 31% / reading 54%, grade D-, #183 of 493 statewide, top 37%, 371 students, 46% FRL); Bullock Creek High School (math 37% / reading 52%, grade F, #214 of 713 statewide, top 36%, 490 students, 33% FRL).
- Market conditions: 113 active listings in the ZIP; solid renter incomes; 320 units permitted in Midland County in 2024 (204 in 5+ unit buildings).
- Midland County population projected to shrink 9% by 2050 — rents likely to lag national; underwrite the cash flow, not the appreciation.
- Current owner paid $64k; list at $179k implies a 180% gain — meaningful room to come down on a strong offer.
- Cap rate 6.1% vs local median 4.4% in Midland — top-decile yield for the area; either an underpriced asset or a hidden risk that comps aren't pricing in. Stress-test before assuming the spread holds.
Questions for listing agent
- What do current leases actually rent for vs. the listed asking? Can we see a recent rent roll and the last 12 months of T-12 income?
- Is there a deadline driving the sale (1031 exchange, divorce, estate, relocation)? That informs how much negotiation room exists.
- Schools are A-rated — typically a magnet for longer-tenancy family renters. What's the average tenant stay here, and is there a school-zone premium baked into asking?
- The area grade is low — what's the realistic commute time and amenity access for the typical tenant pool here? Any planned neighborhood developments (good or bad) we should know about?
- What's the average days-on-market for RENTAL listings here right now (not sales)? A rising rental-DOM trend means longer vacancies and softer asking-rent achievability than the comps imply.
- What's the recent tenant-quality profile in this submarket — average credit score on applications, eviction rate, late-payment / NSF rate, and stable-employment percentage? A property-management company in the area should have these aggregated.
- How much new for-sale + rental construction is in the pipeline within 1–3 miles? Heavy new supply typically softens prices + rents 12–24 months out; constrained supply supports both.
CashFlowRE · CFR-H8G87A8Q5ARN9T
· Data 3 weeks ago
cashflowre.app · 2026-05-29