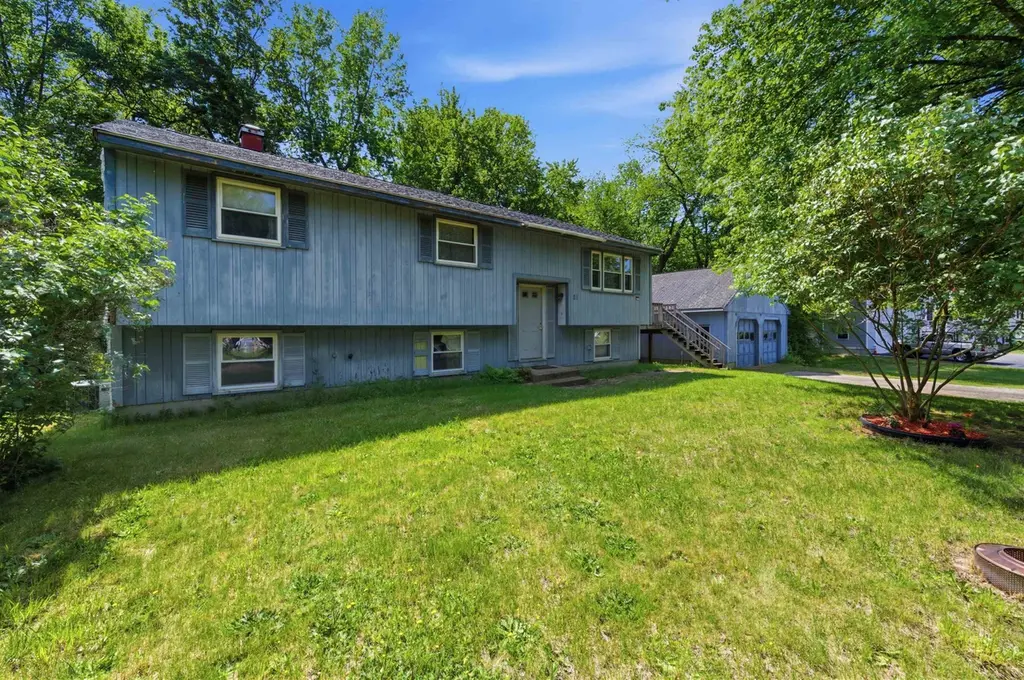
21 Greenfield Dr
East Merrimack, NH 03054
$390,000D+
4 bd · 1.0 ba ·
1,705 sqft ·
Built 1971
· SingleFamily
· Pending
· 6 DOM
Cashflow @ list (25.0% down · 7.5%)
Estimated rent
$3,472/mo
Mortgage (P&I)
−$2,045
Tax + insurance
−$821
HOA
−$0
Vac / Maint / Mgmt
−$729
Net cashflow
$-123/mo
Annual
$-1,475/yr
Cap rate
5.91%
Cash-on-cash
-1.35%
DSCR
0.94
1% rule
0.89%
Cash to close
$109,200
Investor read
- This is a 4-bed/1.0-bath single-family listed at $390k.
- At list price, monthly cash flow is $-123 ($-1k/yr) — negative.
- To cash-flow at today's rent, offer at most $368k (5.6% below list).
- To meet the 1% rule (rent ≥ 1% of price), the offer needs to be $347k (11.0% below list).
- Only 6 days on market — expect competitive offers; lowballing is unlikely to land.
- Recommended offer: $347k (11.0% below list) — sets the bar for 1% rule.
- Local home prices are declining (-3.0%/yr); year-one equity from $3k of loan paydown is wiped out by about $12k of value loss. Plan a longer hold.
- Location reads 76/100 on livability (#23 in NH, #3,310 nationally) — a middle-class / working-renter tenant base. Strengths: crime A+, housing A+, health & safety A+; Watch: amenities F, commute F.
- Merrimack School District (suburban): math 36% / reading 55% proficiency, ranked #41 of 98 in NH (top 42%) — families likely to look elsewhere, expect single-tenant / working-renter base with shorter leases; only 8% free/reduced lunch — higher-income household profile.
- Zoned schools: James Mastricola Elementary School (math 42% / reading 47%, grade F, #126 of 263 statewide, top 52%, 420 students, 10% FRL) — zoned schools at 10% FRL track the district average.
- Market conditions: Rents rising (+3.4%/yr); 97 active listings in the ZIP; 3 comparable units currently listed for rent nearby; rentals at typical pace (median 14d on market — plan ~3-4 weeks tenant-placement turnaround); high-income renter base; 981 units permitted in Hillsborough County in 2024 (381 in 5+ unit buildings).
- Hillsborough County population projected to shrink 8% by 2050 — rents likely to lag national; underwrite the cash flow, not the appreciation.
- Cap rate 5.9% vs local median 3.2% in East Merrimack — top-decile yield for the area; either an underpriced asset or a hidden risk that comps aren't pricing in. Stress-test before assuming the spread holds.
- This rent runs 33% of the median local income ($127k/yr) — at the standard rent-burdened threshold; future hikes will face affordability resistance.
Questions for listing agent
- What do current leases actually rent for vs. the listed asking? Can we see a recent rent roll and the last 12 months of T-12 income?
- Built in 1971 — when were the roof, HVAC, electrical panel, plumbing, and water heater last replaced?
- Is there a deadline driving the sale (1031 exchange, divorce, estate, relocation)? That informs how much negotiation room exists.
- Schools are B-rated — typically a magnet for longer-tenancy family renters. What's the average tenant stay here, and is there a school-zone premium baked into asking?
- The area grade is low — what's the realistic commute time and amenity access for the typical tenant pool here? Any planned neighborhood developments (good or bad) we should know about?
- What's the average days-on-market for RENTAL listings here right now (not sales)? A rising rental-DOM trend means longer vacancies and softer asking-rent achievability than the comps imply.
- What's the recent tenant-quality profile in this submarket — average credit score on applications, eviction rate, late-payment / NSF rate, and stable-employment percentage? A property-management company in the area should have these aggregated.
- How much new for-sale + rental construction is in the pipeline within 1–3 miles? Heavy new supply typically softens prices + rents 12–24 months out; constrained supply supports both.
CashFlowRE · CFR-H947DM0EGZ8KFQ
· Data 6 days ago
cashflowre.app · 2026-05-29