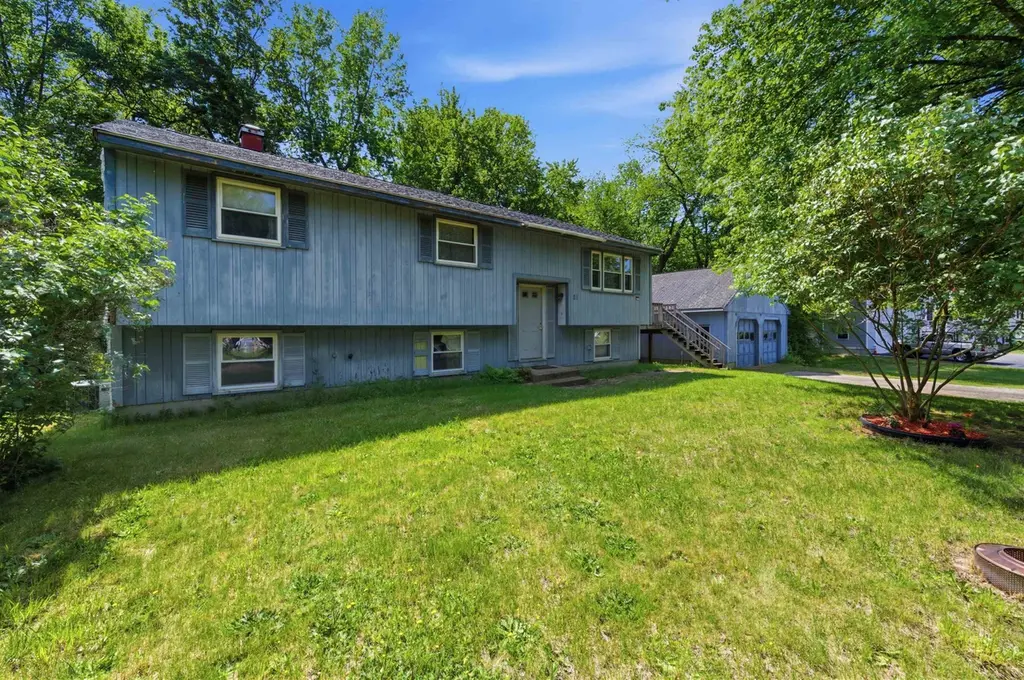
21 Greenfield Dr · East Merrimack, NH
Flood risk 1/10 · Minimal
- FEMA flood zone
- X (unshaded)
- Chance of flooding over 30 yrs
- 0.0%
- Est. flood insurance / yr
- $473 – $860
Fire risk 1/10 · Minimal
- Est. fire insurance / yr
- $507 – $941
Heat risk 4/10 · Minor
- Hot days now (above 95°F)
- 7 days/yr
- Hot days in 30 yrs
- 15 days/yr
Wind risk 4/10 · Minor
- Chance of severe wind over 30 yrs
- 23.0%
Air-quality risk 2/10 · Minimal
- Unhealthy air days now
- 0 days/yr
- Unhealthy air days in 30 yrs
- 2 days/yr
Risk factors via First Street. Map © Google.
Why this score? — see what drove the D+ grade
The composite is a weighted blend of 9 inputs, each scored 0–100. Each bar is that input's sub-score; the figure is the points it added to the 100-point composite (weight × sub-score).
- ARV discount +15.0/15.0
- Cash flow +11.6/30.0
- Schools +4.3/10.0
- 1% rule +3.9/10.0
- Livability +3.8/5.0
- DSCR +3.4/10.0
- Rent growth +3.4/5.0
- Condition / age +2.5/5.0
- Appreciation +0.0/10.0
$390,000
🖨 Deal sheet 📄 Offer letter ✓ Due diligence
Listing remarks
This is the opportunity smart buyers have been waiting for. While the competition fights over turnkey homes at peak prices, this 4-bed, 1 bath Merrimack split-level sits on a quiet dead-end street in an established neighborhood, priced for the buyer who sees what it can become. The . 56-acre corner lot gives you privacy and space. The oversized detached 2-car garage with storage gives you the workshop, the hobby space, or a contractor's dream setup. Four bedrooms, a few bonus rooms and over 1,700 square feet give you the canvas. Cash buyers, investors, contractor-owners, and buyers with a renovation vision — this is where equity is built. All contents convey. Sold as-is. OFFER DEADLIN
Key facts
- Workshop space
- Corner lot
- Hobby space
Tags
Property features AI
Exterior
- Parking: 2-car garage
- Utilities: Drilled well for water; Septic system; 200 Amp electrical service; Cable available; Internet availability unknown
- Home design: Split-level design; Blue exterior
- Construction: Built in 1971; Wood siding; Asphalt shingle roof
- Exterior features: Corner lot; Level, neighborhood lot; Paved driveway; Road frontage (paved)
Interior
- Kitchen: Dishwasher; Microwave; Electric range; Refrigerator
- Flooring: Hardwood; Laminate
- Bathrooms: 1 full bathroom
- Heating & cooling: Oil-fired forced air heat; Central air conditioning
- Interior features: 6 total rooms; Finished basement with interior and exterior access; walkout and interior stairs
- Laundry & utility: Washer; Dryer
Neighborhood map
What this means for you Summary
Snapshot
- This is a 4-bed/1.0-bath single-family listed at $390k.
Deal economics
- At list price, monthly cash flow is $-123 ($-1k/yr) — negative.
- To cash-flow at today's rent, offer at most $368k (5.6% below list).
- To meet the 1% rule (rent ≥ 1% of price), the offer needs to be $347k (11.0% below list).
- Recommended offer: $347k (11.0% below list) — sets the bar for 1% rule.
- Cap rate 5.9% vs local median 3.2% in East Merrimack — top-decile yield for the area; either an underpriced asset or a hidden risk that comps aren't pricing in. Stress-test before assuming the spread holds.
Location & tenants
- Location reads 76/100 on livability (#23 in NH, #3,310 nationally) — a middle-class / working-renter tenant base. Strengths: crime A+, housing A+, health & safety A+; Watch: amenities F, commute F.
- Merrimack School District (suburban): math 36% / reading 55% proficiency, ranked #41 of 98 in NH (top 42%) — families likely to look elsewhere, expect single-tenant / working-renter base with shorter leases; only 8% free/reduced lunch — higher-income household profile.
- Zoned schools: James Mastricola Elementary School (math 42% / reading 47%, grade F, #126 of 263 statewide, top 52%, 420 students, 10% FRL) — zoned schools at 10% FRL track the district average.
- Market conditions: Rents rising (+3.4%/yr); 97 active listings in the ZIP; 3 comparable units currently listed for rent nearby; rentals leasing fast (median 14d on market — plan ~1-2 weeks tenant-placement turnaround); high-income renter base; 981 units permitted in Hillsborough County in 2024 (381 in 5+ unit buildings).
- This rent runs 33% of the median local income ($127k/yr) — at the standard rent-burdened threshold; future hikes will face affordability resistance.
Forward outlook
- Local home prices are declining (-3.0%/yr); year-one equity from $3k of loan paydown is wiped out by about $12k of value loss. Plan a longer hold.
- Hillsborough County population projected to shrink 8% by 2050 — rents likely to lag national; underwrite the cash flow, not the appreciation.
Negotiation context
- Only 6 days on market — expect competitive offers; lowballing is unlikely to land.
Questions for the listing agent
- What do current leases actually rent for vs. the listed asking? Can we see a recent rent roll and the last 12 months of T-12 income?
- Built in 1971 — when were the roof, HVAC, electrical panel, plumbing, and water heater last replaced?
- Is there a deadline driving the sale (1031 exchange, divorce, estate, relocation)? That informs how much negotiation room exists.
- Schools are B-rated — typically a magnet for longer-tenancy family renters. What's the average tenant stay here, and is there a school-zone premium baked into asking?
- The area grade is low — what's the realistic commute time and amenity access for the typical tenant pool here? Any planned neighborhood developments (good or bad) we should know about?
- What's the average days-on-market for RENTAL listings here right now (not sales)? A rising rental-DOM trend means longer vacancies and softer asking-rent achievability than the comps imply.
- What's the recent tenant-quality profile in this submarket — average credit score on applications, eviction rate, late-payment / NSF rate, and stable-employment percentage? A property-management company in the area should have these aggregated.
- How much new for-sale + rental construction is in the pipeline within 1–3 miles? Heavy new supply typically softens prices + rents 12–24 months out; constrained supply supports both.
Investment metrics
- 1% rule
- 0.89% ✗
- Cap rate
- 5.91%
- Cash-on-cash
- -1.35%
- DSCR
- 0.94
- GRM
- 9.4
CMA / ARV
- ARV (on-the-fly)
- $499,565
- Comps found
- 10
Show comp detail 10 sales within ~0.75 mi
| Address | Dist | Beds/Ba | Sqft | Sold | Price | $/sf | Match |
|---|---|---|---|---|---|---|---|
| 7 Fairway Dr | 0.13mi | 3/1.0 (-1) | 1,708 (+0%) | 11mo | $410,000 | $240 | 79 |
| 49 Fairway Dr | 0.29mi | 3/1.5 (-1) | 1,724 (+1%) | 22mo | $480,000 | $278 | 59 |
| 5 Dumpling Way | 0.26mi | 3/2.0 (-1) | 1,834 (+8%) | 14mo | $470,000 | $256 | 55 |
| 11 Mount Lawny Ln | 0.26mi | 3/1.5 (-1) | 1,559 (-9%) | 15mo | $485,000 | $311 | 54 |
| 10 Waterville Dr | 0.66mi | 4/2.0 | 1,750 (+3%) | 9mo | $513,000 | $293 | 53 |
| 68 Back River Rd | 0.41mi | 3/2.0 (-1) | 1,660 (-3%) | 23mo | $575,000 | $346 | 48 |
| 51 Back River Rd | 0.61mi | 3/1.0 (-1) | 1,920 (+13%) | 8mo | $475,000 | $247 | 39 |
| 10 Brookfield Dr | 0.73mi | 3/2.0 (-1) | 1,711 (+0%) | 22mo | $480,000 | $281 | 38 |
| 40 Belmont Dr | 0.63mi | 4/2.0 | 1,492 (-12%) | 18mo | $490,000 | $328 | 30 |
| 31 Belmont Dr | 0.71mi | 3/1.0 (-1) | 1,512 (-11%) | 19mo | $475,000 | $314 | 27 |
Match score weights: distance 35% · size 25% · config 20% · recency 20%. Top-matched comps best support the ARV.
Projected returns pro-forma
-3.0% appreciation · 3.42% rent growth · sell at horizon
- IRR
- -18.0%
- Equity multiple
- 0.36×
- Total profit
- $-69,396
- Equity at exit
- $58,150
- IRR
- -9.3%
- Equity multiple
- 0.42×
- Total profit
- $-63,772
- Equity at exit
- $33,720
Cash invested: $109,200 (down + closing). Projections, not guarantees.
Landlord ↔ Tenant lean methodology
- Overall (STATE)
- 56 Moderately Landlord-Leaning
- State New Hampshire
- 56 Moderately Landlord-Leaning · D+1
- County
- — inherits STATE
- City
- — inherits STATE
ZIP-level market 03054
- Rents YoY
- 3.4%
- Active inventory
- 97
- Price-to-rent
- 9.4×
Monthly cashflow live
- Estimated rent
- $3,472 medium interval (Pro) →
- Mortgage (P&I)
- −$2,045
- Tax from tax record
- −$658 /mo · $7,902/yr
- Insurance
- −$162
- HOA
- −$0
- Vacancy / Maint / Mgmt
- −$729
- Net cashflow
- $-123
Break-even live
UW: 25.0% down · 7.5% · 30yr · 1.5% tax · 5.0% vac · 8.0% maint · 8.0% mgmt
Financing live
Cash to close
- Down payment
- $97,500
- Closing costs
- $11,700
- Reserves months
- —
- Total cash needed
- —
Loan-product check · same deal, 3 products live
Conventional
25% down · 7.5% · 30yr
- Down + closing
- —
- Monthly P&I
- —
- Monthly cashflow
- —
- DSCR
- —
- Eligible?
- —
Personal DTI + credit; lowest rate.
DSCR
20% down · 8.5% · 30yr
- Down + closing
- —
- Monthly P&I
- —
- Monthly cashflow
- —
- DSCR
- —
- Eligible?
- —
No personal income docs; deal must DSCR.
Hard money
10% down · 12.0% · 12mo
- Down + closing
- —
- Monthly P&I
- —
- Monthly cashflow
- —
- DSCR
- —
- Eligible?
- —
Short-term bridge; refi at stabilization.
Rent comps 3 comps
| Address | Beds | Baths | Sqft | Rent | $/sqft | DOM | Units | Dist |
|---|---|---|---|---|---|---|---|---|
| 5 Aspen Ln Merrimack, NH | 3.0 | 3.0 | 2080 | $3,300 | $1.59 | 13d | 1 | 0.21mi |
| 7A Mustang Dr Litchfield, NH | 3.0 | 2.5 | 1440 | $3,400 | $2.36 | 13d | 1 | 1.29mi |
| 540 Charles Bancroft Hwy Unit 6B Litchfield, NH | 3.0 | 2.5 | 1450 | $3,600 | $2.48 | 13d | 1 | 1.44mi |
Listing history 7 events
-
2026-06-13status $390,000 Pending 6 DOM
-
2026-06-10remarks 693-char remark
-
2026-06-10days on market $390,000 Active 6 DOM
-
2026-06-09days on market $390,000 Active 5 DOM
-
2026-06-08days on market $390,000 Active 4 DOM
-
2026-06-07remarks 679-char remark
-
2026-06-07$390,000 Active 3 DOM
ⓘ Source: listings_history table (triggers on properties + properties_extension) + one-shot
backfill from property_details.listing_events for pre-trigger history.
Tax reassessment forecast NH · Partial reset (capped growth)
- Current annual tax
- $7,902 · $658/mo
- Projected year-2 tax
- $8,202 · $684/mo
- Expected delta
- +$300/yr (+$25/mo · 3.8%)
ⓘ Screening estimate from a state-policy table — verify with the county assessor before closing.
Climate risk First Street
- Flood 1/10 Low FEMA zone X (unshaded) · 0% chance over 30 yrs
- Wildfire 1/10 Low
- Heat 4/10 Moderate 7 d/yr ≥95°F today · 15 d/yr by 30 yrs out
- Wind 4/10 Moderate 23% chance of damaging wind over 30 yrs
- Air quality 2/10 Low 0 unhealthy d/yr today · 2 by 30 yrs out
Nearby sold comps map
Loading sold comps map…
Walkable amenities ~0.75 mi
Loading nearby amenities…
Taxation est. · year 1
- Rental income
- $41,670
- − Mortgage interest
- −$21,846
- − Property taxes
- −$7,902
- − Insurance
- −$1,950
- − Repairs & maintenance
- −$3,334
- − Management
- −$3,334
- − Depreciation
- −$11,345
- Taxable loss
- −$8,041
- Est. tax savings @ 24.0%
- +$1,930
- After-tax cash flow
- $455/yr
For passive investors: Depreciation is non-cash, so a rental often shows a tax loss while cash-flowing — sheltering income. Rental losses are passive: they offset passive income freely, and up to $25,000/yr can offset ordinary (W-2) income if you actively participate and your MAGI is under $100k (phasing out to $0 by $150k); unused losses carry forward. On sale, claimed depreciation is recaptured at up to 25%, and gains may owe capital-gains tax (a 1031 exchange can defer both). Figures are a year-1 estimate at your 24.0% rate — not tax advice; consult a CPA.
Schools (NCES district)
- District
- Merrimack School District
- NCES district ID
- 3304740
- Math proficiency
- 36% ▼ -18.00%
- Reading proficiency
- 55% ▼ -2.00%
- Median HH income
- $91,055
- Composite
- 42.9/100
- National rank
- #3121
- State rank
- #41 of 98 in NH
Livability — East Merrimack
- Score
- 76/100
- State rank
- #23
- US rank
- #3310
Category grades
Schools grade is shown separately in the Schools card above.
Census & demographics
- County
- Hillsborough County · 309,362 people
- Metro
- Manchester-Nashua, NH
- Population (ZIP)
- 28,176
- Household income
- $127,303
- Rent vs Own
- Severe rent burden
- 124.0
Population outlook (Hillsborough County) Hauer SSP2
- Today (2025)
- 412,771 people
- By 2030
- 410,974 · -0.4%
- By 2040
- 399,959 · -3.1%
- By 2050
- 381,542 · -7.6%
- By 2075
- 339,855 · -17.7%
- By 2100
- 289,270 · -29.9%
Race, ethnicity, and origin ACS 2023
- Neighborhood character
- Predominantly White (86%)
- Race & ethnicity
- White 86% Hispanic / Latino 5% Asian 5% Two or more races 4%
- Hispanic origin (detail)
- Puerto Rican 2%
- Common ancestry
- Lithuanian 10% Romanian 4% Italian 3%
- Foreign-born
- 7% · Canada, South Korea, Jamaica
- Languages at home
- 92% English-only · Other Indo-European 2% Spanish 2% French/Haitian/Cajun 2%
Political lean MEDSL · Hillsborough
- 2024 margin
- Toss-up / Even · D 50.9% · R 48.0% · Other 1.0%
- 2008→2024 swing
- -0.9pp no change · 2008: 3.8pp · 2024: 2.9pp
- All cycles
- 2024: D+2.9 2020: D+7.7 2016: R+0.2 2012: D+1.7 2008: D+3.8
Not yet ingested
- Civics
- —
Market trends
- HPI YoY
- ▼ -229.70%
- Current HPI
- 346.4656
- Rent YoY
- ▲ 3.42%
- Metro
- Manchester-Nashua, NH
- State GDP YoY
- —
- F500 in state
- 0
Price history
1 event — show timeline
- 2026-06-04 Listed $390,000 PrimeMLS
Property tax history
+3.2%/yrLatest (2025): $7,902 · +6.9% YoY. Source: county tax records.
Cash-flow waterfall
monthlySold comps — $/sqft
last 12 mo · ≤1 miLoading sold comps…