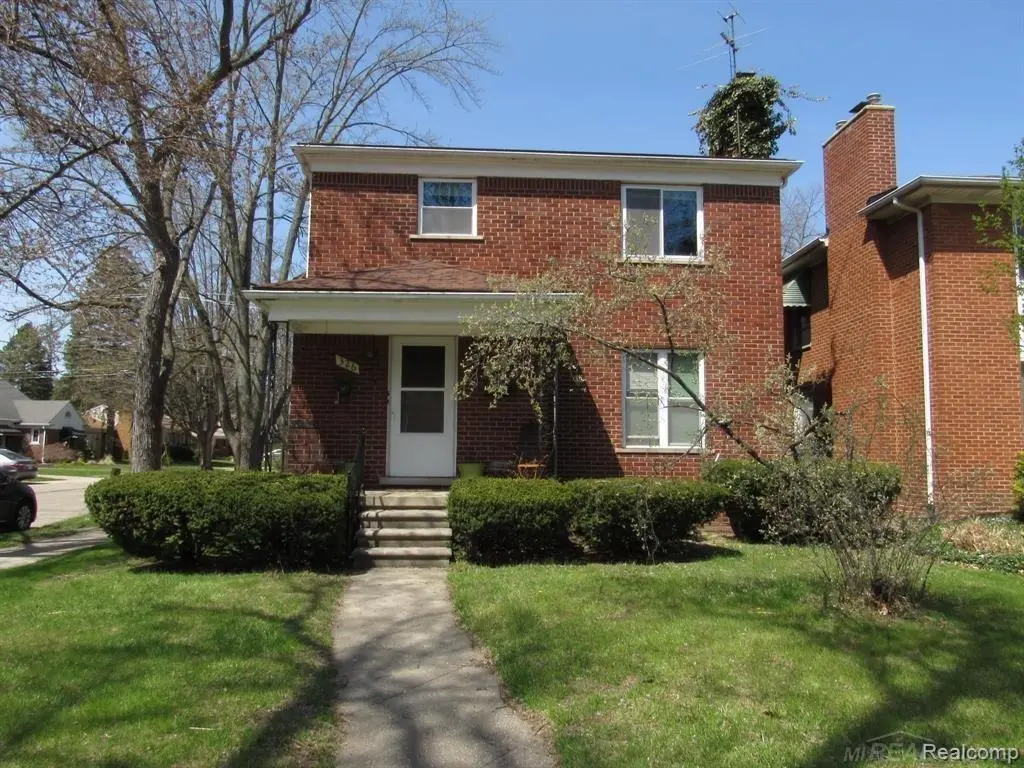
326 Catalpa Dr
Royal Oak, MI 48067
$1,550D+
2 bd · 1.5 ba ·
1,080 sqft ·
Built 1953
· MultiFamily
· Active
· 8 DOM
Cashflow @ list (25.0% down · 7.5%)
Estimated rent
$3,282/mo
Mortgage (P&I)
−$8
Tax + insurance
−$3
HOA
−$0
Vac / Maint / Mgmt
−$689
Net cashflow
$2,582/mo
Annual
$30,985/yr
Cap rate
2005.31%
Cash-on-cash
7139.36%
DSCR
318.66
1% rule
211.74%
Cash to close
$434
Investor read
- This is a 2-bed/1.5-bath multifamily listed at $2k.
- At list price, monthly cash flow is $3k ($31k/yr) — positive.
- The deal already cash-flows at list — no discount required.
- Meets the 1% rule at list price ($3k rent vs $2k).
- Only 8 days on market — expect competitive offers; lowballing is unlikely to land.
- Local home prices are declining (-3.0%/yr); year-one equity from $10 of loan paydown is wiped out by about $46 of value loss. Plan a longer hold.
- Location reads 83/100 on livability (#50 in MI, #1,020 nationally) — a professional / high-income tenant draw. Strengths: crime A+, commute A+, employment A+; Watch: amenities D+.
- Royal Oak Schools (suburban): math 41% / reading 59% proficiency, ranked #89 of 540 in MI (top 16%) — acceptable for families but not a draw, mixed tenant base, ~2y average lease; only 20% free/reduced lunch — higher-income household profile.
- Watch-outs: built in 1953 — expect roof / HVAC / electrical / plumbing capex.
- Market conditions: Rents rising fast (+4.7%/yr); 209 active listings in the ZIP; 40 comparable units currently listed for rent nearby; rentals at typical pace (median 22d on market — plan ~3-4 weeks tenant-placement turnaround); high-income renter base; 2,614 units permitted in Oakland County in 2024 (721 in 5+ unit buildings).
- Oakland County population projected at +10% by 2050 — modest demand growth; plan on rents tracking national, not racing it.
- At projected returns (-3.0% appreciation + 4.7% rent growth), your $434 cash investment doubles in ~1 year — after that, you're playing with house money.
- Cap rate 2005.3% vs local median 3.8% in Royal Oak — top-decile yield for the area; either an underpriced asset or a hidden risk that comps aren't pricing in. Stress-test before assuming the spread holds.
- This rent runs 35% of the median local income ($113k/yr) — at the standard rent-burdened threshold; future hikes will face affordability resistance.
Questions for listing agent
- Built in 1953 — when were the roof, HVAC, electrical panel, plumbing, and water heater last replaced?
- Is there a deadline driving the sale (1031 exchange, divorce, estate, relocation)? That informs how much negotiation room exists.
- Schools are B-rated — typically a magnet for longer-tenancy family renters. What's the average tenant stay here, and is there a school-zone premium baked into asking?
- The area grade is low — what's the realistic commute time and amenity access for the typical tenant pool here? Any planned neighborhood developments (good or bad) we should know about?
- What's the average days-on-market for RENTAL listings here right now (not sales)? A rising rental-DOM trend means longer vacancies and softer asking-rent achievability than the comps imply.
- What's the recent tenant-quality profile in this submarket — average credit score on applications, eviction rate, late-payment / NSF rate, and stable-employment percentage? A property-management company in the area should have these aggregated.
- How much new apartment / multifamily construction is in the pipeline within 1–3 miles? Heavy new supply (>2% of stock underway) typically softens rents 12–24 months out; light construction supports rent growth.
CashFlowRE · CFR-HBKHH41ZTHC24T
· Data 2 days ago
cashflowre.app · 2026-05-29