 Multi-family
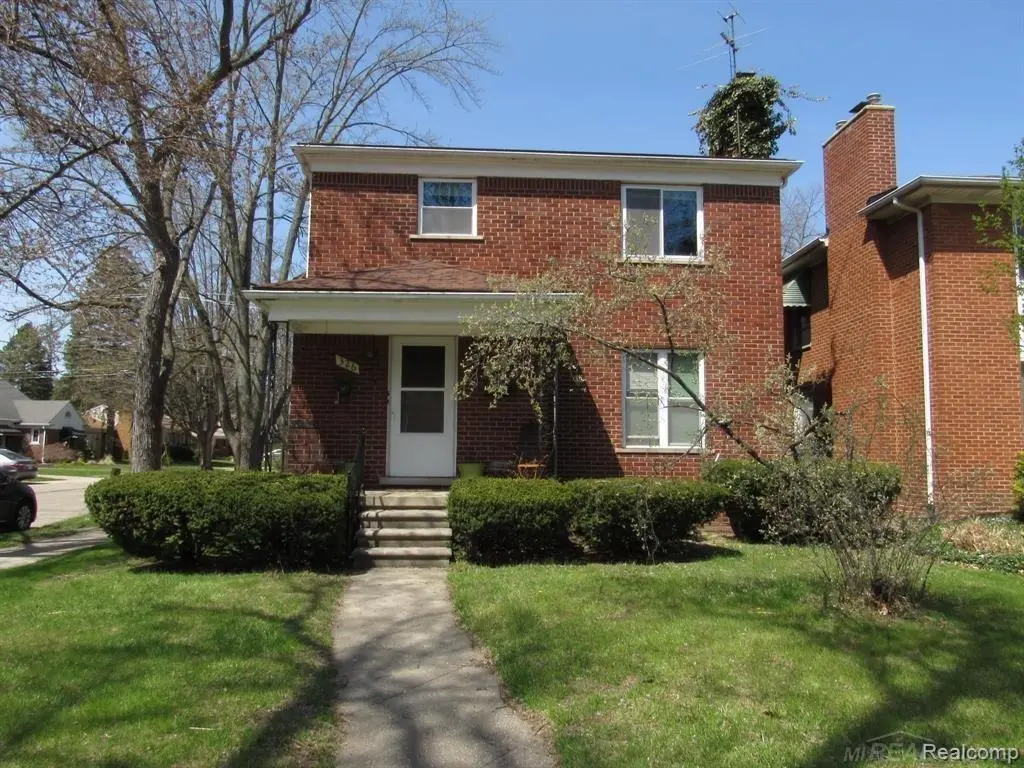
326 Catalpa Dr · Royal Oak, MI
Flood risk 1/10 · Minimal
- FEMA flood zone
- X (unshaded)
- Chance of flooding over 30 yrs
- 0.0%
- Est. flood insurance / yr
- $507 – $1,088
Fire risk 1/10 · Minimal
- Est. fire insurance / yr
- $784 – $1,456
Heat risk 2/10 · Minimal
- Hot days now (above 97°F)
- 7 days/yr
- Hot days in 30 yrs
- 15 days/yr
Wind risk 2/10 · Minimal
- Chance of severe wind over 30 yrs
- —
Air-quality risk 3/10 · Minor
- Unhealthy air days now
- 3 days/yr
- Unhealthy air days in 30 yrs
- 5 days/yr
Risk factors via First Street. Map © Google.
Why this score? — see what drove the D+ grade
The composite is a weighted blend of 9 inputs, each scored 0–100. Each bar is that input's sub-score; the figure is the points it added to the 100-point composite (weight × sub-score).
- Cash flow +15.0/30.0
- ARV discount +7.5/15.0
- 1% rule +5.0/10.0
- DSCR +5.0/10.0
- Schools +4.4/10.0
- Livability +4.2/5.0
- Rent growth +3.7/5.0
- Condition / age +2.5/5.0
- Appreciation +0.0/10.0
$1,550
🖨 Deal sheet 📄 Offer letter ✓ Due diligence
Multi-family units
County records classify this as Multi-Family (2-4 Unit). Listing-text estimate: 1 unit. estimate disagrees with records
Listing remarks
Solid Brick multi-family with large, spacious rooms and hardwood floors throughout. Upper and lower flats share a common basement with separate laundry facilities. Great location on a corner lot, very close to downtown Royal Oak.
Key facts
- Common basement
- Hardwood floors
- Corner lot
Tags
Property features AI
Finance
- Other: Listing broker: Professional Leasing & Sales LLC; Listing agent: Sheila Mazzoline
Exterior
- Parking: Detached 1-car garage
- Utilities: Public water; Public sewer
- Home design: Two-story multi-family residential income property; Above-grade finished area approximately 1,080 square feet; Subdivision: EVANS HIGHLAND 2
- Exterior features: Lot dimensions approximately 38 x 128; Lot area about 0.11 acres
Interior
- Bathrooms: 1 full bathroom; 1 half bathroom
- Heating & cooling: Forced air heating (natural gas); Separate meters for heating; No central cooling
- Interior features: Basement
Neighborhood map
What this means for you Summary
Snapshot
- This is a 2-bed/1.5-bath multifamily listed at $2k.
Deal economics
- At list price, monthly cash flow is $3k ($31k/yr) — positive.
- The deal already cash-flows at list — no discount required.
- Meets the 1% rule at list price ($3k rent vs $2k).
- Cap rate 2005.3% vs local median 3.8% in Royal Oak — top-decile yield for the area; either an underpriced asset or a hidden risk that comps aren't pricing in. Stress-test before assuming the spread holds.
Location & tenants
- Location reads 83/100 on livability (#50 in MI, #1,020 nationally) — a professional / high-income tenant draw. Strengths: crime A+, commute A+, employment A+; Watch: amenities D+.
- Royal Oak Schools (suburban): math 41% / reading 59% proficiency, ranked #89 of 540 in MI (top 16%) — acceptable for families but not a draw, mixed tenant base, ~2y average lease; only 20% free/reduced lunch — higher-income household profile.
- Market conditions: Rents rising fast (+4.7%/yr); 209 active listings in the ZIP; 40 comparable units currently listed for rent nearby; rentals at typical pace (median 22d on market — plan ~3-4 weeks tenant-placement turnaround); high-income renter base; 2,614 units permitted in Oakland County in 2024 (721 in 5+ unit buildings).
- This rent runs 35% of the median local income ($113k/yr) — at the standard rent-burdened threshold; future hikes will face affordability resistance.
Forward outlook
- Local home prices are declining (-3.0%/yr); year-one equity from $10 of loan paydown is wiped out by about $46 of value loss. Plan a longer hold.
- Oakland County population projected at +10% by 2050 — modest demand growth; plan on rents tracking national, not racing it.
- At projected returns (-3.0% appreciation + 4.7% rent growth), your $434 cash investment doubles in ~1 year — after that, you're playing with house money.
Negotiation context
- Only 8 days on market — expect competitive offers; lowballing is unlikely to land.
Risks & watch-outs
- Watch-outs: built in 1953 — expect roof / HVAC / electrical / plumbing capex.
Questions for the listing agent
- Built in 1953 — when were the roof, HVAC, electrical panel, plumbing, and water heater last replaced?
- Is there a deadline driving the sale (1031 exchange, divorce, estate, relocation)? That informs how much negotiation room exists.
- Schools are B-rated — typically a magnet for longer-tenancy family renters. What's the average tenant stay here, and is there a school-zone premium baked into asking?
- The area grade is low — what's the realistic commute time and amenity access for the typical tenant pool here? Any planned neighborhood developments (good or bad) we should know about?
- What's the average days-on-market for RENTAL listings here right now (not sales)? A rising rental-DOM trend means longer vacancies and softer asking-rent achievability than the comps imply.
- What's the recent tenant-quality profile in this submarket — average credit score on applications, eviction rate, late-payment / NSF rate, and stable-employment percentage? A property-management company in the area should have these aggregated.
- How much new apartment / multifamily construction is in the pipeline within 1–3 miles? Heavy new supply (>2% of stock underway) typically softens rents 12–24 months out; light construction supports rent growth.
Investment metrics
- 1% rule
- 211.74% ✓
- Cap rate
- 2005.31%
- Cash-on-cash
- 7139.36%
- DSCR
- 318.66
- GRM
- 0.0
CMA / ARV
No comps found within radius.
Projected returns pro-forma
-3.0% appreciation · 4.72% rent growth · sell at horizon
- IRR
- —
- Equity multiple
- 392.77×
- Total profit
- $170,029
- Equity at exit
- $231
- IRR
- —
- Equity multiple
- 887.11×
- Total profit
- $384,573
- Equity at exit
- $134
Cash invested: $434 (down + closing). Projections, not guarantees.
Landlord ↔ Tenant lean methodology
- Overall (STATE)
- 62 Landlord-Friendly
- State Michigan
- 62 Landlord-Friendly · EVEN
- County
- — inherits STATE
- City
- — inherits STATE
ZIP-level market 48067
- Rents YoY
- 4.7%
- Active inventory
- 209
- Price-to-rent
- 0.1×
Monthly cashflow live
- Estimated rent
- $3,282 high interval (Pro) →
- Mortgage (P&I)
- −$8
- Tax est. 1.5%
- −$2 /mo · $23/yr
- Insurance
- −$1
- HOA
- −$0
- Vacancy / Maint / Mgmt
- −$689
- Net cashflow
- $2,582
Break-even live
2-unit breakdown (identical units grouped — click to expand)
| Units | Beds | Baths | Est. rent |
|---|---|---|---|
| 2× units | 2 | 1.5 | $3,282 |
| #1 | 2 | 1.5 | $1,641 |
| #2 | 2 | 1.5 | $1,641 |
| Total (2 units) | $3,282 | ||
UW: 25.0% down · 7.5% · 30yr · 1.5% tax · 5.0% vac · 8.0% maint · 8.0% mgmt
Financing live
Cash to close
- Down payment
- $388
- Closing costs
- $46
- Reserves months
- —
- Total cash needed
- —
Loan-product check · same deal, 3 products live
Conventional
25% down · 7.5% · 30yr
- Down + closing
- —
- Monthly P&I
- —
- Monthly cashflow
- —
- DSCR
- —
- Eligible?
- —
Personal DTI + credit; lowest rate.
DSCR
20% down · 8.5% · 30yr
- Down + closing
- —
- Monthly P&I
- —
- Monthly cashflow
- —
- DSCR
- —
- Eligible?
- —
No personal income docs; deal must DSCR.
Hard money
10% down · 12.0% · 12mo
- Down + closing
- —
- Monthly P&I
- —
- Monthly cashflow
- —
- DSCR
- —
- Eligible?
- —
Short-term bridge; refi at stabilization.
Rent comps 40 comps
| Address | Beds | Baths | Sqft | Rent | $/sqft | DOM | Units | Dist |
|---|---|---|---|---|---|---|---|---|
| 418 Austin Ave Royal Oak, MI | 3.0 | 1.0 | 946 | $2,200 | $2.33 | 3d | 1 | 0.17mi |
| 1414 Crooks Rd Unit 2 Royal Oak, MI | 3.0 | 2.0 | 1400 | $1,800 | $1.29 | 24d | 1 | 0.22mi |
| 430 N Washington Ave Unit A Royal Oak, MI | 2.0 | 1.0 | 1150 | $1,895 | $1.65 | 24d | 1 | 0.36mi |
| 480 N Main St Royal Oak, MI | 1.0–2.0 | 1.0–2.0 | 1045 | $4,645 | $4.44 | 1d | 7 | 0.43mi |
| 314 Oakland Ave Royal Oak, MI | 1.0 | 1.0 | 700 | $1,750 | $2.50 | 24d | 1 | 0.43mi |
| 1723 Edgewood Dr Unit Labs Royal Oak, MI | 3.0 | 3.0 | 1451 | $3,000 | $2.07 | 5d | 1 | 0.44mi |
| 308 W Twelve Mile Rd Unit 4/D Royal Oak, MI | 3.0 | 1.0 | 1000 | $2,200 | $2.20 | 19d | 1 | 0.45mi |
| 1814 N Center St Royal Oak, MI | 3.0 | 1.5 | 1072 | $1,790 | $1.67 | 3d | 1 | 0.49mi |
| 201 N Lafayette Ave Royal Oak, MI | 1.0–2.0 | 1.0 | 755 | $1,587 | $2.10 | 1d | 6 | 0.50mi |
| 350 N Main St #806 Royal Oak, MI | 2.0 | 2.0 | 1100 | $2,400 | $2.18 | 24d | 1 | 0.52mi |
| 350 N Main St Unit 608 Royal Oak, MI | 2.0 | 2.0 | 1137 | $2,500 | $2.20 | 24d | 1 | 0.52mi |
| 118 N Main St Royal Oak, MI | 3.0 | 1.0–3.0 | 1432 | $4,848 | $3.38 | 1d | 4 | 0.57mi |
| 1923 Crooks Rd Unit 1923-18 Royal Oak, MI | 2.0 | 1.0 | 1000 | $1,350 | $1.35 | 24d | 1 | 0.58mi |
| 1880 Rochester Rd Royal Oak, MI | 1.0–2.0 | 1.0 | 900 | $1,550 | $1.72 | 21d | 1 | 0.60mi |
| 1125 N Sherman Dr Apt 36 Royal Oak, MI | 1.0 | 1.0 | 800 | $1,150 | $1.44 | 14d | 1 | 0.62mi |
| 1031 N Sherman Dr Unit A Royal Oak, MI | 3.0 | 2.5 | 1500 | $3,000 | $2.00 | 1d | 1 | 0.62mi |
| 122 W Houstonia Ave Unit B Royal Oak, MI | 2.0 | 1.0 | 800 | $1,350 | $1.69 | 20d | 1 | 0.67mi |
| 122 W Houstonia Ave Royal Oak, MI | 2.0 | 1.0 | 800 | $1,350 | $1.69 | 24d | 1 | 0.67mi |
| 1607 Catalpa Dr Unit 1607 Catalpa Royal Oak, MI | 2.0 | 1.0 | 950 | $2,100 | $2.21 | 24d | 1 | 0.72mi |
| 609 E Eleven Mile Rd Royal Oak, MI | 1.0–2.0 | 1.0 | 925 | $1,375 | $1.49 | 24d | 1 | 0.76mi |
| 1007 Gardenia Ave Unit 1009 Royal Oak, MI | 2.0 | 1.0 | 1000 | $1,400 | $1.40 | 24d | 1 | 0.79mi |
| 432 S Washington Ave #1506 Royal Oak, MI | 1.0 | 1.5 | 1004 | $3,400 | $3.39 | 21d | 1 | 0.80mi |
| 100 W 5th St Royal Oak, MI | 2.0 | 2.0 | 1119 | $3,200 | $2.86 | 24d | 2 | 0.81mi |
| 100 W 5th St Royal Oak, MI | 2.0 | 2.0 | 1283 | $3,015 | $2.35 | 5d | 2 | 0.81mi |
| 310 W 6th St Unit 310-309 Royal Oak, MI | 1.0 | 1.0 | 700 | $1,495 | $2.14 | 24d | 1 | 0.85mi |
| 325 E 6th St Unit 325-05 Royal Oak, MI | 1.0 | 1.0 | 1000 | $1,795 | $1.79 | 21d | 1 | 0.91mi |
| 325 E 6th St Unit 325-08 Royal Oak, MI | 1.0 | 1.0 | 1000 | $1,725 | $1.73 | 17d | 1 | 0.91mi |
| 325 E 6th St Unit 325-10 Royal Oak, MI | 2.0 | 1.5 | 1400 | $1,895 | $1.35 | 5d | 1 | 0.91mi |
| 409 E 6th St Unit 2 Royal Oak, MI | 1.0 | 1.0 | 850 | $1,355 | $1.59 | 24d | 1 | 0.93mi |
| 1079 Larkmoor Blvd Berkley, MI | 3.0 | 1.5 | 1152 | $2,350 | $2.04 | 24d | 1 | 0.98mi |
| 855 S Main St Royal Oak, MI | 1.0 | 1.0 | 1003 | $2,508 | $2.50 | 1d | 1 | 1.06mi |
| 2540 Rochester Rd Royal Oak, MI | 1.0 | 1.0 | 700 | $1,040 | $1.49 | 24d | 1 | 1.10mi |
| 2702 N Main St Royal Oak, MI | 3.0 | 1.5 | 1500 | $2,350 | $1.57 | 2d | 1 | 1.12mi |
| 1100 S Main St Royal Oak, MI | 1.0–2.0 | 1.0–2.0 | 1179 | $6,000 | $5.09 | 1d | 3 | 1.23mi |
| 739 S Alexander Ave Unit Top Level Royal Oak, MI | 1.0 | 1.0 | 900 | $1,200 | $1.33 | 17d | 1 | 1.23mi |
| 429 Linden Ave Royal Oak, MI | 3.0 | 1.0 | 909 | $1,995 | $2.19 | 24d | 1 | 1.24mi |
| 1725 Gardenia Ave Royal Oak, MI | 2.0 | 1.0 | 900 | $1,350 | $1.50 | 24d | 1 | 1.25mi |
| 1132 N Campbell Rd Royal Oak, MI | 1.0–3.0 | 1.0–1.5 | 1050 | $1,722 | $1.64 | 1d | 7 | 1.28mi |
| 1674 Eaton Rd Berkley, MI | 3.0 | 2.0 | 1500 | $2,975 | $1.98 | 43d | 1 | 1.31mi |
| 1230 Diamond Ct Unit E Royal Oak, MI | 2.0 | 2.0 | 1212 | $2,800 | $2.31 | 24d | 1 | 1.36mi |
Listing history 6 events
-
2026-06-18days on market $1,550 Active 8 DOM
-
2026-06-17days on market $1,550 Active 7 DOM
-
2026-06-16days on market $1,550 Active 6 DOM
-
2026-06-15days on market $1,550 Active 5 DOM
-
2026-06-13remarks 229-char remark
-
2026-06-13$1,550 Active 3 DOM
ⓘ Source: listings_history table (triggers on properties + properties_extension) + one-shot
backfill from property_details.listing_events for pre-trigger history.
Climate risk First Street
- Flood 1/10 Low FEMA zone X (unshaded) · 0% chance over 30 yrs
- Wildfire 1/10 Low
- Heat 2/10 Low 7 d/yr ≥97°F today · 15 d/yr by 30 yrs out
- Wind 2/10 Low
- Air quality 3/10 Moderate 3 unhealthy d/yr today · 5 by 30 yrs out
Nearby sold comps map
Loading sold comps map…
Walkable amenities ~0.75 mi
Loading nearby amenities…
Taxation est. · year 1
- Rental income
- $39,384
- − Mortgage interest
- −$87
- − Property taxes
- −$23
- − Insurance
- −$8
- − Repairs & maintenance
- −$3,151
- − Management
- −$3,151
- − Depreciation
- −$45
- Taxable income
- $32,920
- Est. tax owed @ 24.0%
- −$7,901
- After-tax cash flow
- $23,084/yr
For passive investors: Depreciation is non-cash, so a rental often shows a tax loss while cash-flowing — sheltering income. Rental losses are passive: they offset passive income freely, and up to $25,000/yr can offset ordinary (W-2) income if you actively participate and your MAGI is under $100k (phasing out to $0 by $150k); unused losses carry forward. On sale, claimed depreciation is recaptured at up to 25%, and gains may owe capital-gains tax (a 1031 exchange can defer both). Figures are a year-1 estimate at your 24.0% rate — not tax advice; consult a CPA.
Schools (NCES district)
- District
- Royal Oak Schools
- NCES district ID
- 2630300
- Math proficiency
- 41% ▼ -10.00%
- Reading proficiency
- 59% ▼ -3.00%
- Median HH income
- $65,456
- Composite
- 44.19/100
- National rank
- #2853
- State rank
- #89 of 540 in MI
Livability — Royal Oak
- Score
- 83/100
- State rank
- #50
- US rank
- #1020
Category grades
Schools grade is shown separately in the Schools card above.
Census & demographics
- Census place
- Royal Oak, MI
- County
- Oakland County · 1,009,092 people
- City population
- 57,974
- Metro
- Detroit-Warren-Dearborn, MI
- Population (ZIP)
- 24,868
- Household income
- $112,840
- Rent vs Own
- Severe rent burden
- 625.0
Population outlook (Oakland County) Hauer SSP2
- Today (2025)
- 1,335,747 people
- By 2030
- 1,375,100 · +2.9%
- By 2040
- 1,435,385 · +7.5%
- By 2050
- 1,469,250 · +10.0%
- By 2075
- 1,531,946 · +14.7%
- By 2100
- 1,450,485 · +8.6%
Race, ethnicity, and origin ACS 2023
- Neighborhood character
- Predominantly White (82%)
- Race & ethnicity
- White 82% Hispanic / Latino 7% Two or more races 7% Black 3% Asian 3%
- Hispanic origin (detail)
- Mexican 3%
- Common ancestry
- Romanian 12% Lithuanian 4% Slovak 4%
- Foreign-born
- 7% · Canada, China, South Korea
- Languages at home
- 92% English-only · Spanish 2% Other Indo-European 2% Russian/Polish/Slavic 1%
Political lean MEDSL · Oakland
- 2024 margin
- D (+10.6) · D 54.4% · R 43.8% · Other 1.9%
- 2008→2024 swing
- -3.9pp toward R · 2008: 14.5pp · 2024: 10.6pp
- All cycles
- 2024: D+10.6 2020: D+14.1 2016: D+8.1 2012: D+8.1 2008: D+14.5
Not yet ingested
- Civics
- —
Market trends
- HPI YoY
- ▼ -571.62%
- Current HPI
- 224.5887
- Rent YoY
- ▲ 4.72%
- Metro
- Detroit-Warren-Dearborn, MI
- State GDP YoY
- ▲ 1.37%
- F500 in state
- 28
Industry mix (Fortune 500 HQ in MI)
| Industry | F500 HQs | Revenue |
|---|---|---|
| Automotive Parts | 3 | $48B |
|
||
| Automotive | 2 | $372B |
|
||
| Chemicals | 1 | $45B |
|
||
| Automotive Retail | 1 | $29B |
|
||
| Healthcare / Medical Devices | 1 | $23B |
|
||
| Automotive Technology | 1 | $20B |
|
||
Price history
1 event — show timeline
- 2026-06-11 Listed $1,550 REALCOMP
Cash-flow waterfall
monthlySold comps — $/sqft
last 12 mo · ≤1 miLoading sold comps…