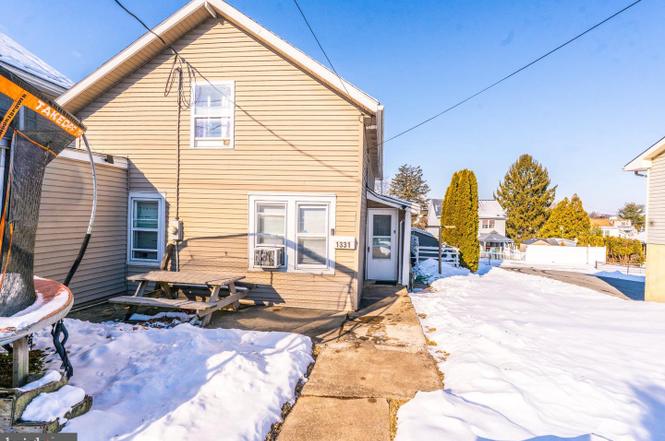
1331 New Holland Rd
Kenhorst, PA 19607
$264,900D+
3 bd · 2.5 ba ·
2,174 sqft ·
Built 1930
· SingleFamily
· Pending
· 8 DOM
Cashflow @ list (25.0% down · 7.5%)
Estimated rent
$2,121/mo
Mortgage (P&I)
−$1,389
Tax + insurance
−$374
HOA
−$0
Vac / Maint / Mgmt
−$445
Net cashflow
$-88/mo
Annual
$-1,058/yr
Cap rate
5.89%
Cash-on-cash
-1.43%
DSCR
0.94
1% rule
0.80%
Cash to close
$74,172
Investor read
- This is a 3-bed/2.5-bath single-family listed at $265k.
- At list price, monthly cash flow is $-88 ($-1k/yr) — negative.
- To cash-flow at today's rent, offer at most $249k (5.9% below list).
- To meet the 1% rule (rent ≥ 1% of price), the offer needs to be $212k (19.9% below list).
- Only 8 days on market — expect competitive offers; lowballing is unlikely to land.
- Recommended offer: $212k (19.9% below list) — sets the bar for 1% rule.
- Local home prices are declining (-3.0%/yr); year-one equity from $2k of loan paydown is wiped out by about $8k of value loss. Plan a longer hold.
- Location reads 79/100 on livability (#232 in PA, #2,012 nationally) — a middle-class / working-renter tenant base. Strengths: crime A+, cost of living A+, housing A+; Watch: amenities C-, commute F.
- Governor Mifflin SD (suburban): math 31% / reading 50% proficiency, ranked #325 of 539 in PA (top 60%) — families likely to look elsewhere, expect single-tenant / working-renter base with shorter leases.
- Zoned schools: Mifflin Park El Sch (math 32% / reading 57%, grade F, #815 of 1,518 statewide, top 56%, 505 students, 64% FRL); Governor Mifflin Ms (math 18% / reading 51%, grade F, #328 of 512 statewide, top 65%, 629 students, 54% FRL); Governor Mifflin Shs (math 50% / reading 24%, grade F, #288 of 437 statewide, top 66%, 1,480 students, 44% FRL) — zoned schools average 54% FRL vs 27% district-wide (27 pts higher); higher-poverty schools than district average — tighter screening recommended.
- Watch-outs: built in 1930 — expect roof / HVAC / electrical / plumbing capex.
- Market conditions: 90 active listings in the ZIP; solid renter incomes; 258 units permitted in Berks County in 2024 (27 in 5+ unit buildings).
- Berks County population projected at +3% by 2050 — modest demand growth; plan on rents tracking national, not racing it.
- 16 sale attempts since 21y ago with the ask held roughly flat each time — persistent listings suggest the price (not the market) is what's stuck; bring a comps-based counter.
- Climate carrying-cost: extreme-heat days projected 7→16/yr by 2055 (HVAC capex compounding) — expect insurance premiums to compound above CPI over the hold.
- This rent runs 31% of the median local income ($81k/yr) — at the standard rent-burdened threshold; future hikes will face affordability resistance.
Questions for listing agent
- What do current leases actually rent for vs. the listed asking? Can we see a recent rent roll and the last 12 months of T-12 income?
- Built in 1930 — when were the roof, HVAC, electrical panel, plumbing, and water heater last replaced?
- Is there a deadline driving the sale (1031 exchange, divorce, estate, relocation)? That informs how much negotiation room exists.
- Schools are A-rated — typically a magnet for longer-tenancy family renters. What's the average tenant stay here, and is there a school-zone premium baked into asking?
- The area grade is low — what's the realistic commute time and amenity access for the typical tenant pool here? Any planned neighborhood developments (good or bad) we should know about?
- What's the average days-on-market for RENTAL listings here right now (not sales)? A rising rental-DOM trend means longer vacancies and softer asking-rent achievability than the comps imply.
- What's the recent tenant-quality profile in this submarket — average credit score on applications, eviction rate, late-payment / NSF rate, and stable-employment percentage? A property-management company in the area should have these aggregated.
- How much new for-sale + rental construction is in the pipeline within 1–3 miles? Heavy new supply typically softens prices + rents 12–24 months out; constrained supply supports both.
CashFlowRE · CFR-HCC9RMCDJWD1WS
· Data 4 weeks ago
cashflowre.app · 2026-05-29