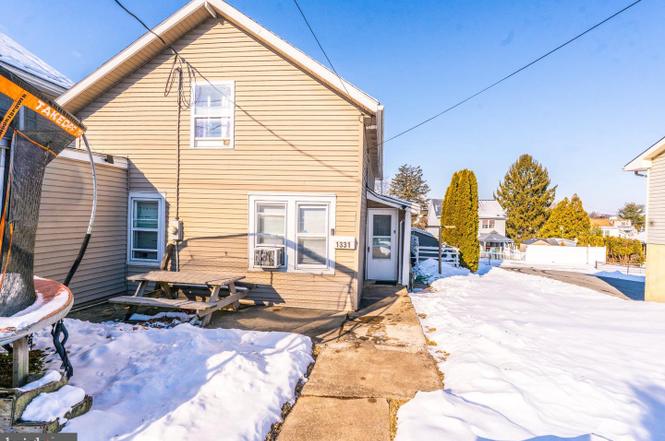
1331 New Holland Rd · Kenhorst, PA
Flood risk 1/10 · Minimal
- FEMA flood zone
- X (unshaded)
- Chance of flooding over 30 yrs
- 0.0%
- Est. flood insurance / yr
- $473 – $860
Fire risk 3/10 · Minor
- Est. fire insurance / yr
- $511 – $949
Heat risk 5/10 · Moderate
- Hot days now (above 100°F)
- 7 days/yr
- Hot days in 30 yrs
- 16 days/yr
Wind risk 4/10 · Minor
- Chance of severe wind over 30 yrs
- 14.0%
Air-quality risk 3/10 · Minor
- Unhealthy air days now
- 1 days/yr
- Unhealthy air days in 30 yrs
- 4 days/yr
Risk factors via First Street. Map © Google.
Why this score? — see what drove the D+ grade
The composite is a weighted blend of 9 inputs, each scored 0–100. Each bar is that input's sub-score; the figure is the points it added to the 100-point composite (weight × sub-score).
- ARV discount +15.0/15.0
- Cash flow +11.5/30.0
- Livability +4.0/5.0
- Schools +3.6/10.0
- DSCR +3.4/10.0
- 1% rule +3.0/10.0
- Rent growth +2.5/5.0
- Condition / age +2.5/5.0
- Appreciation +0.0/10.0
$264,900
🖨 Deal sheet (PDF) 📄 Offer letter ✓ Due diligence
Listing remarks MLS
Recently converted to gas, and central air only needs the unit.
Key facts
- 4,791 sq ft lot
- Garage
- Built 1930
Neighborhood map
What this means for you Summary
Snapshot
- This is a 3-bed/2.5-bath single-family listed at $265k.
Deal economics
- At list price, monthly cash flow is $-88 ($-1k/yr) — negative.
- To cash-flow at today's rent, offer at most $249k (5.9% below list).
- To meet the 1% rule (rent ≥ 1% of price), the offer needs to be $212k (19.9% below list).
- Recommended offer: $212k (19.9% below list) — sets the bar for 1% rule.
Location & tenants
- Location reads 79/100 on livability (#232 in PA, #2,012 nationally) — a middle-class / working-renter tenant base. Strengths: crime A+, cost of living A+, housing A+; Watch: amenities C-, commute F.
- Governor Mifflin SD (suburban): math 31% / reading 50% proficiency, ranked #325 of 539 in PA (top 60%) — families likely to look elsewhere, expect single-tenant / working-renter base with shorter leases.
- Zoned schools: Mifflin Park El Sch (math 32% / reading 57%, grade F, #815 of 1,518 statewide, top 56%, 505 students, 64% FRL); Governor Mifflin Ms (math 18% / reading 51%, grade F, #328 of 512 statewide, top 65%, 629 students, 54% FRL); Governor Mifflin Shs (math 50% / reading 24%, grade F, #288 of 437 statewide, top 66%, 1,480 students, 44% FRL) — zoned schools average 54% FRL vs 27% district-wide (27 pts higher); higher-poverty schools than district average — tighter screening recommended.
- Market conditions: 90 active listings in the ZIP; solid renter incomes; 258 units permitted in Berks County in 2024 (27 in 5+ unit buildings).
- This rent runs 31% of the median local income ($81k/yr) — at the standard rent-burdened threshold; future hikes will face affordability resistance.
Forward outlook
- Local home prices are declining (-3.0%/yr); year-one equity from $2k of loan paydown is wiped out by about $8k of value loss. Plan a longer hold.
- Berks County population projected at +3% by 2050 — modest demand growth; plan on rents tracking national, not racing it.
Negotiation context
- Only 8 days on market — expect competitive offers; lowballing is unlikely to land.
- 16 sale attempts since 21y ago with the ask held roughly flat each time — persistent listings suggest the price (not the market) is what's stuck; bring a comps-based counter.
Risks & watch-outs
- Watch-outs: built in 1930 — expect roof / HVAC / electrical / plumbing capex.
- Climate carrying-cost: extreme-heat days projected 7→16/yr by 2055 (HVAC capex compounding) — expect insurance premiums to compound above CPI over the hold.
Questions for the listing agent
- What do current leases actually rent for vs. the listed asking? Can we see a recent rent roll and the last 12 months of T-12 income?
- Built in 1930 — when were the roof, HVAC, electrical panel, plumbing, and water heater last replaced?
- Is there a deadline driving the sale (1031 exchange, divorce, estate, relocation)? That informs how much negotiation room exists.
- Schools are A-rated — typically a magnet for longer-tenancy family renters. What's the average tenant stay here, and is there a school-zone premium baked into asking?
- The area grade is low — what's the realistic commute time and amenity access for the typical tenant pool here? Any planned neighborhood developments (good or bad) we should know about?
- What's the average days-on-market for RENTAL listings here right now (not sales)? A rising rental-DOM trend means longer vacancies and softer asking-rent achievability than the comps imply.
- What's the recent tenant-quality profile in this submarket — average credit score on applications, eviction rate, late-payment / NSF rate, and stable-employment percentage? A property-management company in the area should have these aggregated.
- How much new for-sale + rental construction is in the pipeline within 1–3 miles? Heavy new supply typically softens prices + rents 12–24 months out; constrained supply supports both.
Investment metrics
- 1% rule
- 0.80% ✗
- Cap rate
- 5.89%
- Cash-on-cash
- -1.43%
- DSCR
- 0.94
- GRM
- 10.4
CMA / ARV
- ARV (on-the-fly)
- $330,448
- Comps found
- 12
Show comp detail 12 sales within ~0.75 mi
| Address | Dist | Beds/Ba | Sqft | Sold | Price | $/sf | Match |
|---|---|---|---|---|---|---|---|
| 1331 New Holland Rd | 0.00mi | 4/2.0 (+1) | 2,174 (0%) | 2mo | $270,000 | $124 | 92 |
| 1522 Kenhorst Blvd | 0.23mi | 3/2.5 | 2,144 (-1%) | 9mo | $325,000 | $152 | 79 |
| 526 Harding Ave | 0.56mi | 3/1.5 | 2,202 (+1%) | 3mo | $350,000 | $159 | 65 |
| 211 John Glenn Ave | 0.49mi | 3/1.5 | 2,052 (-6%) | 1mo | $383,500 | $187 | 63 |
| 1435 Kenhorst Blvd | 0.15mi | 3/1.5 | 1,928 (-11%) | 9mo | $290,000 | $150 | 63 |
| 549 Meade Tc | 0.64mi | 3/2.0 | 2,102 (-3%) | 8mo | $324,000 | $154 | 56 |
| 603 E Grill Ave | 0.58mi | 3/2.0 | 2,056 (-5%) | 8mo | $305,000 | $148 | 55 |
| 603 Governor Dr | 0.62mi | 4/2.5 (+1) | 2,250 (+4%) | 9mo | $339,000 | $151 | 53 |
| 524 Harding Ave | 0.58mi | 3/1.5 | 1,928 (-11%) | 2mo | $370,000 | $192 | 49 |
| 719 Loblolly Ln | 0.73mi | 3/2.0 | 2,260 (+4%) | 10mo | $353,000 | $156 | 49 |
| 204 High Blvd | 0.55mi | 4/1.5 (+1) | 2,438 (+12%) | 1mo | $350,000 | $144 | 44 |
| 1530 Liggett Ave | 0.55mi | 3/1.5 | 2,475 (+14%) | 6mo | $220,000 | $89 | 42 |
Match score weights: distance 35% · size 25% · config 20% · recency 20%. Top-matched comps best support the ARV.
Projected returns pro-forma
-3.0% appreciation · 3.0% rent growth · sell at horizon
- IRR
- -18.7%
- Equity multiple
- 0.35×
- Total profit
- $-48,552
- Equity at exit
- $39,497
- IRR
- -11.1%
- Equity multiple
- 0.33×
- Total profit
- $-49,550
- Equity at exit
- $22,904
Cash invested: $74,172 (down + closing). Projections, not guarantees.
Landlord ↔ Tenant lean methodology
- Overall (STATE)
- 62 Landlord-Friendly
- State Pennsylvania
- 62 Landlord-Friendly · EVEN
- County
- — inherits STATE
- City
- — inherits STATE
ZIP-level market 19607
- Home prices YoY
- -14.1%
- Active inventory
- 90
- Price-to-rent
- 10.4×
Monthly cashflow live
- Estimated rent
- $2,121 medium interval (Pro) →
- Mortgage (P&I)
- −$1,389
- Tax from tax record
- −$264 /mo · $3,168/yr
- Insurance
- −$110
- HOA
- −$0
- Vacancy / Maint / Mgmt
- −$445
- Net cashflow
- $-88
Break-even live
Sensitivity live
| Price | -10% $62 | -5% $-13 | +0% $-88 | +5% $-163 | +10% $-238 |
|---|---|---|---|---|---|
| Rent | -10% $-256 | -5% $-172 | +0% $-88 | +5% $-4 | +10% $79 |
| Rate | -1.0pp $45 | -0.5pp $-21 | base $-88 | +0.5pp $-157 | +1.0pp $-227 |
UW: 25.0% down · 7.5% · 30yr · 1.5% tax · 5.0% vac · 8.0% maint · 8.0% mgmt
Financing live
Cash to close
- Down payment
- $66,225
- Closing costs
- $7,947
- Reserves months
- —
- Total cash needed
- —
Loan-product check · same deal, 3 products live
Conventional
25% down · 7.5% · 30yr
- Down + closing
- —
- Monthly P&I
- —
- Monthly cashflow
- —
- DSCR
- —
- Eligible?
- —
Personal DTI + credit; lowest rate.
DSCR
20% down · 8.5% · 30yr
- Down + closing
- —
- Monthly P&I
- —
- Monthly cashflow
- —
- DSCR
- —
- Eligible?
- —
No personal income docs; deal must DSCR.
Hard money
10% down · 12.0% · 12mo
- Down + closing
- —
- Monthly P&I
- —
- Monthly cashflow
- —
- DSCR
- —
- Eligible?
- —
Short-term bridge; refi at stabilization.
Listing history 50 events
-
2026-05-08soldstatus $270,000
-
2026-03-07status Pending
-
2026-02-14historical
-
2026-02-07$264,900 Active
-
2026-02-06historical $264,900
-
2018-11-07soldstatus $135,000
-
2018-11-02soldstatus $135,000 Closed 63-char remark
Show marketing remark (63 chars)
Recently converted to gas, and central air only needs the unit.
-
2018-09-19status Pending 63-char remark
Show marketing remark (63 chars)
Recently converted to gas, and central air only needs the unit.
-
2018-09-07$135,000 Active 63-char remark
Show marketing remark (63 chars)
Recently converted to gas, and central air only needs the unit.
-
2018-07-16historical
-
2018-07-11status Active
-
2018-06-23status Pending
-
2018-05-29$135,000 Active
-
2017-12-27soldstatus $120,000
-
2017-12-22soldstatus $120,000 Sold
-
2017-12-22soldstatus $120,000
-
2017-11-28status Under Contract
-
2017-11-01price $127,500
-
2017-09-15$129,900 Active No-Show
-
2017-09-14$127,500
-
2016-03-29soldstatus $114,000
-
2016-03-28soldstatus $114,000
-
2016-03-28soldstatus $114,000 Sold
-
2016-03-18status Under Contract
-
2016-03-18historical
-
2015-11-04price $122,000
-
2015-07-24price $120,000
-
2015-07-24price $125,000
-
2015-06-15price $127,000
-
2015-05-13$129,900 Active
-
2015-05-12$122,000
-
2013-02-21soldstatus $102,000
-
2013-02-19soldstatus $102,000 Sold
-
2013-02-19soldstatus $102,000
-
2012-12-26status Under Contract
-
2012-12-21historical
-
2012-12-21historical
-
2012-12-05price $104,900
-
2012-11-26price $109,900
-
2012-10-31price $115,900
-
2012-10-16$119,900 Active
-
2012-10-16$104,900
-
2012-02-07soldstatus $57,300
-
2012-02-07soldstatus $57,300
-
2011-12-23historical
-
2011-09-12$89,056
-
2011-09-12$89,056
-
2006-08-08soldstatus $131,000
-
2006-07-28soldstatus $131,000
-
2006-06-16historical
ⓘ Source: listings_history table (triggers on properties + properties_extension) + one-shot
backfill from property_details.listing_events for pre-trigger history.
Tax reassessment forecast PA · Partial reset (capped growth)
- Current annual tax
- $3,168 · $264/mo
- Projected year-2 tax
- $3,677 · $306/mo
- Expected delta
- +$509/yr (+$42/mo · 16.1%)
ⓘ Screening estimate from a state-policy table — verify with the county assessor before closing.
Climate risk First Street
- Flood 1/10 Low FEMA zone X (unshaded) · 0% chance over 30 yrs
- Wildfire 3/10 Moderate
- Heat 5/10 Major 7 d/yr ≥100°F today · 16 d/yr by 30 yrs out
- Wind 4/10 Moderate 14% chance of damaging wind over 30 yrs
- Air quality 3/10 Moderate 1 unhealthy d/yr today · 4 by 30 yrs out
Nearby sold comps map
Loading sold comps map…
Walkable amenities ~0.75 mi
Loading nearby amenities…
Taxation est. · year 1
- Rental income
- $25,449
- − Mortgage interest
- −$14,839
- − Property taxes
- −$3,168
- − Insurance
- −$1,324
- − Repairs & maintenance
- −$2,036
- − Management
- −$2,036
- − Depreciation
- −$7,706
- Taxable loss
- −$5,661
- Est. tax savings @ 24.0%
- +$1,359
- After-tax cash flow
- $300/yr
For passive investors: Depreciation is non-cash, so a rental often shows a tax loss while cash-flowing — sheltering income. Rental losses are passive: they offset passive income freely, and up to $25,000/yr can offset ordinary (W-2) income if you actively participate and your MAGI is under $100k (phasing out to $0 by $150k); unused losses carry forward. On sale, claimed depreciation is recaptured at up to 25%, and gains may owe capital-gains tax (a 1031 exchange can defer both). Figures are a year-1 estimate at your 24.0% rate — not tax advice; consult a CPA.
Schools (NCES district)
- District
- Governor Mifflin SD
- NCES district ID
- 4210860
- Math proficiency
- 31% ▼ -12.00%
- Reading proficiency
- 50% ▼ -11.00%
- Median HH income
- $60,881
- Composite
- 35.88/100
- National rank
- #4815
- State rank
- #325 of 539 in PA
Livability — Kenhorst
- Score
- 79/100
- State rank
- #232
- US rank
- #2012
Category grades
Schools grade is shown separately in the Schools card above.
Census & demographics
- Census place
- Kenhorst, PA
- County
- Berks County · 195,629 people
- Metro
- Reading, PA
- Population (ZIP)
- 24,045
- Household income
- $81,346
- Rent vs Own
- Severe rent burden
- 469.0
Population outlook (Berks County) Hauer SSP2
- Today (2025)
- 425,767 people
- By 2030
- 428,814 · +0.7%
- By 2040
- 433,463 · +1.8%
- By 2050
- 439,426 · +3.2%
- By 2075
- 478,647 · +12.4%
- By 2100
- 518,507 · +21.8%
Race, ethnicity, and origin ACS 2023
- Neighborhood character
- Predominantly White (67%)
- Race & ethnicity
- White 67% Hispanic / Latino 22% Two or more races 12% Black 5% Asian 1%
- Hispanic origin (detail)
- Mexican 3% Puerto Rican 14% Dominican 3%
- Common ancestry
- Romanian 5% Italian 2% Slovak 1%
- Foreign-born
- 7% · Canada, Jamaica
- Languages at home
- 83% English-only · Spanish 14% Russian/Polish/Slavic 1% Other Indo-European 1%
Political lean MEDSL · Berks
- 2024 margin
- R (+12.2) · D 43.4% · R 55.6%
- 2008→2024 swing
- -21.4pp toward R · 2008: 9.2pp · 2024: -12.2pp
- All cycles
- 2024: R+12.2 2020: R+8.2 2016: R+10.2 2012: R+0.6 2008: D+9.2
Not yet ingested
- Civics
- —
Market trends
- HPI YoY
- ▼ -46.25%
- Current HPI
- 282.2782
- Rent YoY
- —
- Metro
- Reading, PA
- State GDP YoY
- ▲ 1.68%
- F500 in state
- 34
Industry mix (Fortune 500 HQ in PA)
| Industry | F500 HQs | Revenue |
|---|---|---|
| Healthcare | 2 | $309B |
|
||
| Insurance | 2 | $27B |
|
||
| Telecommunications / Media | 1 | $124B |
|
||
| Industrial Distribution | 1 | $22B |
|
||
| Financial Services | 1 | $20B |
|
||
| Chemicals / Materials | 1 | $18B |
|
||
Price history
+440.0% since first listed58 events — show timeline
- 2026-05-08 Sold (Public Records) $270,000 Public Records
- 2026-03-07 Pending — BRIGHT MLS
- 2026-02-14 Listing Removed — BRIGHT MLS
- 2026-02-07 Listed $264,900 BRIGHT MLS
- 2026-02-06 Coming Soon $264,900 BRIGHT MLS
- 2018-11-07 Sold (Public Records) $135,000 Public Records
- 2018-11-02 Sold (MLS) $135,000 BRIGHT MLS
- 2018-09-19 Pending — BRIGHT MLS
- 2018-09-07 Listed $135,000 BRIGHT MLS
- 2018-07-16 Listing Removed — BRIGHT MLS
- 2018-07-11 Relisted — BRIGHT MLS
- 2018-06-23 Pending — BRIGHT MLS
- 2018-05-29 Listed $135,000 BRIGHT MLS
- 2017-12-27 Sold (Public Records) $120,000 Public Records
- 2017-12-22 Sold (MLS) $120,000 BRIGHT MLS
- 2017-12-22 Sold (MLS) $120,000 TREND
- 2017-11-28 Pending — TREND
- 2017-11-01 Price Changed $127,500 TREND
- 2017-09-15 Listed $129,900 TREND
- 2017-09-14 Listed $127,500 BRIGHT MLS
- 2016-03-29 Sold (Public Records) $114,000 Public Records
- 2016-03-28 Sold (MLS) $114,000 TREND
- 2016-03-28 Sold (MLS) $114,000 BRIGHT MLS
- 2016-03-18 Pending — TREND
- 2016-03-18 Listing Removed — BRIGHT MLS
- 2015-11-04 Price Changed $122,000 TREND
- 2015-07-24 Price Changed $125,000 TREND
- 2015-07-24 Price Changed $120,000 TREND
- 2015-06-15 Price Changed $127,000 TREND
- 2015-05-13 Listed $129,900 TREND
- 2015-05-12 Listed $122,000 BRIGHT MLS
- 2013-02-21 Sold (Public Records) $102,000 Public Records
- 2013-02-19 Sold (MLS) $102,000 BRIGHT MLS
- 2013-02-19 Sold (MLS) $102,000 TREND
- 2012-12-26 Pending — TREND
- 2012-12-21 Listing Removed — BRIGHT MLS
- 2012-12-21 Delisted — TREND
- 2012-12-05 Price Changed $104,900 TREND
- 2012-11-26 Price Changed $109,900 TREND
- 2012-10-31 Price Changed $115,900 TREND
- 2012-10-16 Listed $104,900 BRIGHT MLS
- 2012-10-16 Listed $119,900 TREND
- 2012-02-07 Sold (MLS) $57,300 TREND
- 2012-02-07 Sold (MLS) $57,300 BRIGHT MLS
- 2011-12-23 Listing Removed — BRIGHT MLS
- 2011-09-12 Listed $89,056 TREND
- 2011-09-12 Listed $89,056 BRIGHT MLS
- 2006-08-08 Sold (Public Records) $131,000 Public Records
- 2006-07-28 Sold (MLS) $131,000 BRIGHT MLS
- 2006-06-16 Listing Removed — BRIGHT MLS
- 2006-05-02 Listing Removed — BRIGHT MLS
- 2006-05-01 Listed $131,000 BRIGHT MLS
- 2006-03-28 Listed $134,900 BRIGHT MLS
- 2006-02-22 Listing Removed — BRIGHT MLS
- 2005-11-01 Listing Removed — BRIGHT MLS
- 2005-10-28 Listed $122,500 BRIGHT MLS
- 2005-07-14 Listed $114,900 BRIGHT MLS
- 2005-06-27 Sold (Public Records) $50,000 Public Records
Property tax history
+3.9%/yrLatest (2026): $3,168 · +0.0% YoY. Source: county tax records.
Cash-flow waterfall
monthlySold comps — $/sqft
last 12 mo · ≤1 miLoading sold comps…