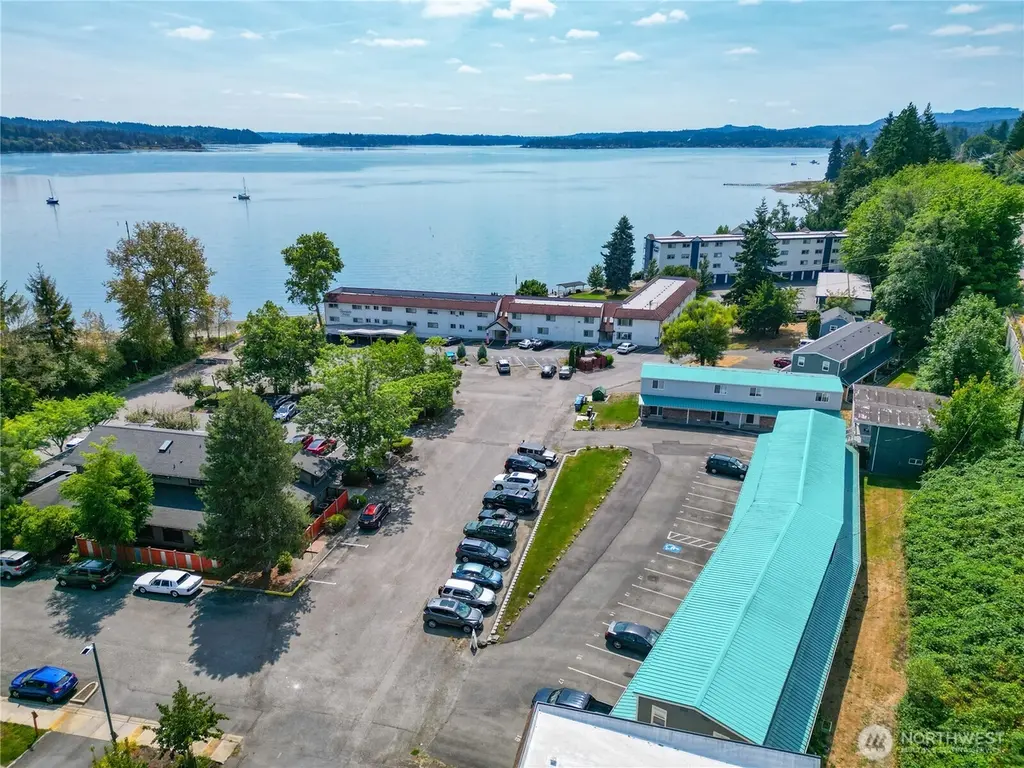
8755 Shore Pl NW
Silverdale, WA 98383
$5,250,000D
4 bd · 4.0 ba ·
3,040 sqft ·
Built 1942
· MultiFamily
· Active
· 283 DOM
Cashflow @ list (25.0% down · 7.5%)
Estimated rent
$43,934/mo
Mortgage (P&I)
−$27,532
Tax + insurance
−$8,750
HOA
−$0
Vac / Maint / Mgmt
−$9,226
Net cashflow
$-1,574/mo
Annual
$-18,885/yr
Cap rate
5.93%
Cash-on-cash
-1.28%
DSCR
0.94
1% rule
0.84%
Cash to close
$1,470,000
Investor read
- This is a 20 × 36-bed/20.0-bath units multifamily listed at $5.25M.
- At list price, monthly cash flow is $-2k ($-19k/yr) — negative. Per door: $-79/mo.
- To cash-flow at today's rent, offer at most $5.02M (4.3% below list).
- To meet the 1% rule (rent ≥ 1% of price), the offer needs to be $4.39M (16.3% below list).
- It's been on market 283 days — a 12% lower offer ($4.62M) is reasonable based on typical stale-listing flexibility.
- Recommended offer: $4.39M (16.3% below list) — sets the bar for 1% rule.
- Local home prices are declining (-3.0%/yr); year-one equity from $36k of loan paydown is wiped out by about $158k of value loss. Plan a longer hold.
- Location reads 82/100 on livability (#63 in WA, #1,155 nationally) — a professional / high-income tenant draw. Strengths: employment A+, housing A+, health & safety A+; Watch: amenities D-, cost of living F.
- Central Kitsap School District (urban): math 55% / reading 67% proficiency, ranked #49 of 291 in WA (top 17%) — acceptable for families but not a draw, mixed tenant base, ~2y average lease.
- Watch-outs: built in 1942 — expect roof / HVAC / electrical / plumbing capex.
- Market conditions: Rents soft (-2.0%/yr); 120 active listings in the ZIP; 1 comparable units currently listed for rent nearby; high-income renter base; 1,294 units permitted in Kitsap County in 2024 (302 in 5+ unit buildings).
- Kitsap County population projected at +8% by 2050 — modest demand growth; plan on rents tracking national, not racing it.
- 9 sale attempts since 14y ago with the ask held roughly flat each time — persistent listings suggest the price (not the market) is what's stuck; bring a comps-based counter.
- Current owner paid $800k; list at $5.25M implies a 556% gain — meaningful room to come down on a strong offer.
- Cap rate 5.9% vs local median 2.7% in Silverdale — top-decile yield for the area; either an underpriced asset or a hidden risk that comps aren't pricing in. Stress-test before assuming the spread holds.
- At $43,934/mo this rent would consume 474% of the median local household income ($111k/yr) (locally 878% of renters already pay >50% of income on rent) — very limited rent-growth headroom before tenants either downsize or default.
Questions for listing agent
- What do current leases actually rent for vs. the listed asking? Can we see a recent rent roll and the last 12 months of T-12 income?
- It's been on market 283 days. Have you received any prior offers? Is the seller open to a 16% concession, seller financing, or rate buy-down credit?
- Can we see the unit-by-unit rent roll, current vacancy, and any below-market leases? What's the average tenancy length?
- What capital expenditures (roof, boiler, parking lot, exteriors) have been made in the last 5 years, and what's planned in the next 2?
- Built in 1942 — when were the roof, HVAC, electrical panel, plumbing, and water heater last replaced?
- Why hasn't it sold? Are there any deal-killer items the seller is aware of (foundation, flood, title, zoning, code violations)?
- Is there a deadline driving the sale (1031 exchange, divorce, estate, relocation)? That informs how much negotiation room exists.
- Schools are A-rated — typically a magnet for longer-tenancy family renters. What's the average tenant stay here, and is there a school-zone premium baked into asking?
CashFlowRE · CFR-HD54JM0MEC835D
· Data 2 days ago
cashflowre.app · 2026-05-29