 20-Plex
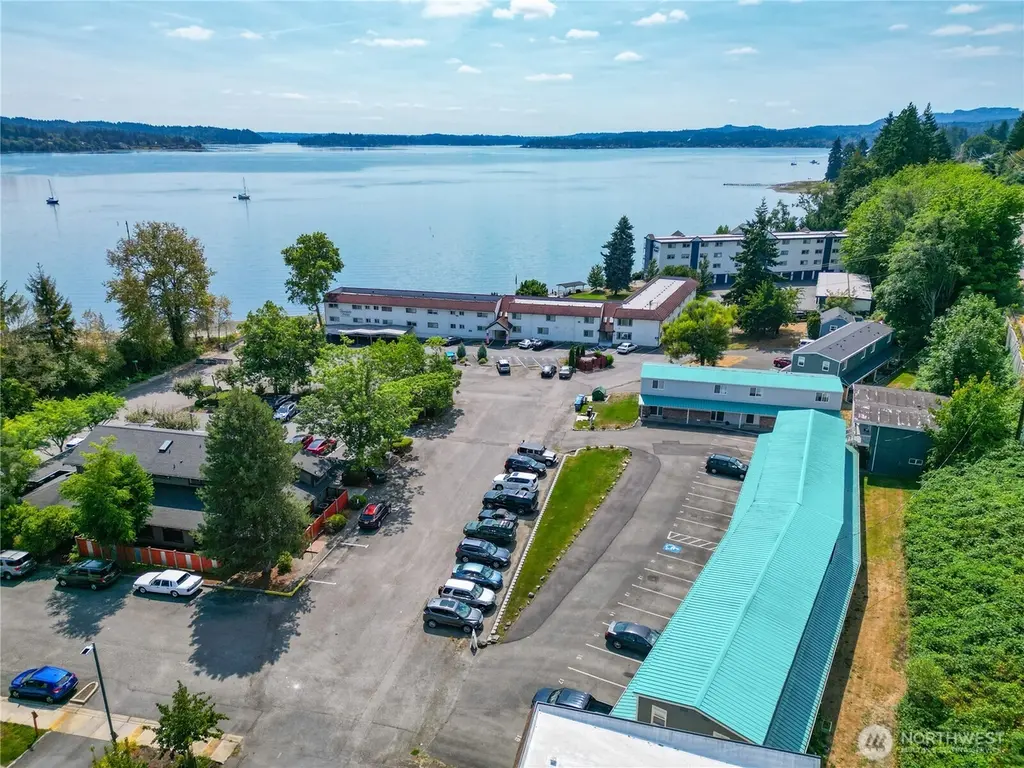
8755 Shore Pl NW · Silverdale, WA
Flood risk 1/10 · Minimal
- FEMA flood zone
- X (unshaded)
- Chance of flooding over 30 yrs
- 0.0%
- Est. flood insurance / yr
- $507 – $1,088
Fire risk 1/10 · Minimal
- Est. fire insurance / yr
- $604 – $1,122
Heat risk 3/10 · Minor
- Hot days now (above 86°F)
- 7 days/yr
- Hot days in 30 yrs
- 16 days/yr
Wind risk 1/10 · Minimal
- Chance of severe wind over 30 yrs
- —
Air-quality risk 7/10 · Major
- Unhealthy air days now
- 10 days/yr
- Unhealthy air days in 30 yrs
- 10 days/yr
Risk factors via First Street. Map © Google.
Why this score? — see what drove the D grade
The composite is a weighted blend of 9 inputs, each scored 0–100. Each bar is that input's sub-score; the figure is the points it added to the 100-point composite (weight × sub-score).
- Cash flow +11.7/30.0
- ARV discount +7.5/15.0
- Schools +5.5/10.0
- Livability +4.1/5.0
- 1% rule +3.4/10.0
- DSCR +3.4/10.0
- Condition / age +2.5/5.0
- Rent growth +2.0/5.0
- Appreciation +0.0/10.0
$5,250,000
🖨 Deal sheet 📄 Offer letter ✓ Due diligence
Multi-family units
County records classify this as Multi-Family (2-4 Unit). Listing-text estimate: 20 units. estimate disagrees with records
Listing remarks
Waterfront Park Apartments offers a rare turnkey investment on the Silverdale waterfront. This fully renovated 20-unit community boasts a 5.97% cap rate and a 6.08% cash-on-cash return on current rents. The property features 16 spacious two-bedroom townhome-style units and 4 one-bedroom units, averaging 758 SF. Ownership has invested over $1.1M in capital improvements, delivering modern finishes and durable systems throughout—new roofs, Hardie siding, cabinetry, stainless steel appliances, in-unit washers/dryers, upgraded electrical and mechanical systems, and stylish interior updates. The result is a low-maintenance, high cash-flowing asset poised to capture long-term rent growth in
Key facts
- Fully renovated
- New roofs
- Modern finishes
Tags
Neighborhood map
What this means for you Summary
Snapshot
- This is a 20 × 36-bed/20.0-bath units multifamily listed at $5.25M.
Deal economics
- At list price, monthly cash flow is $-2k ($-19k/yr) — negative. Per door: $-79/mo.
- To cash-flow at today's rent, offer at most $5.02M (4.3% below list).
- To meet the 1% rule (rent ≥ 1% of price), the offer needs to be $4.39M (16.3% below list).
- Recommended offer: $4.39M (16.3% below list) — sets the bar for 1% rule.
- Cap rate 5.9% vs local median 2.7% in Silverdale — top-decile yield for the area; either an underpriced asset or a hidden risk that comps aren't pricing in. Stress-test before assuming the spread holds.
Location & tenants
- Location reads 82/100 on livability (#63 in WA, #1,155 nationally) — a professional / high-income tenant draw. Strengths: employment A+, housing A+, health & safety A+; Watch: amenities D-, cost of living F.
- Central Kitsap School District (urban): math 55% / reading 67% proficiency, ranked #49 of 291 in WA (top 17%) — acceptable for families but not a draw, mixed tenant base, ~2y average lease.
- Market conditions: Rents soft (-2.0%/yr); 120 active listings in the ZIP; 1 comparable units currently listed for rent nearby; high-income renter base; 1,294 units permitted in Kitsap County in 2024 (302 in 5+ unit buildings).
- At $43,934/mo this rent would consume 474% of the median local household income ($111k/yr) (locally 878% of renters already pay >50% of income on rent) — very limited rent-growth headroom before tenants either downsize or default.
Forward outlook
- Local home prices are declining (-3.0%/yr); year-one equity from $36k of loan paydown is wiped out by about $158k of value loss. Plan a longer hold.
- Kitsap County population projected at +8% by 2050 — modest demand growth; plan on rents tracking national, not racing it.
Negotiation context
- It's been on market 283 days — a 12% lower offer ($4.62M) is reasonable based on typical stale-listing flexibility.
- 9 sale attempts since 14y ago with the ask held roughly flat each time — persistent listings suggest the price (not the market) is what's stuck; bring a comps-based counter.
- Current owner paid $800k; list at $5.25M implies a 556% gain — meaningful room to come down on a strong offer.
Risks & watch-outs
- Watch-outs: built in 1942 — expect roof / HVAC / electrical / plumbing capex.
Questions for the listing agent
- What do current leases actually rent for vs. the listed asking? Can we see a recent rent roll and the last 12 months of T-12 income?
- It's been on market 283 days. Have you received any prior offers? Is the seller open to a 16% concession, seller financing, or rate buy-down credit?
- Can we see the unit-by-unit rent roll, current vacancy, and any below-market leases? What's the average tenancy length?
- What capital expenditures (roof, boiler, parking lot, exteriors) have been made in the last 5 years, and what's planned in the next 2?
- Built in 1942 — when were the roof, HVAC, electrical panel, plumbing, and water heater last replaced?
- Why hasn't it sold? Are there any deal-killer items the seller is aware of (foundation, flood, title, zoning, code violations)?
- Is there a deadline driving the sale (1031 exchange, divorce, estate, relocation)? That informs how much negotiation room exists.
- Schools are A-rated — typically a magnet for longer-tenancy family renters. What's the average tenant stay here, and is there a school-zone premium baked into asking?
- The area grade is low — what's the realistic commute time and amenity access for the typical tenant pool here? Any planned neighborhood developments (good or bad) we should know about?
- What's the average days-on-market for RENTAL listings here right now (not sales)? A rising rental-DOM trend means longer vacancies and softer asking-rent achievability than the comps imply.
- What's the recent tenant-quality profile in this submarket — average credit score on applications, eviction rate, late-payment / NSF rate, and stable-employment percentage? A property-management company in the area should have these aggregated.
- How much new apartment / multifamily construction is in the pipeline within 1–3 miles? Heavy new supply (>2% of stock underway) typically softens rents 12–24 months out; light construction supports rent growth.
Investment metrics
- 1% rule
- 0.84% ✗
- Cap rate
- 5.93%
- Cash-on-cash
- -1.28%
- DSCR
- 0.94
- GRM
- 10.0
CMA / ARV
No comps found within radius.
Projected returns pro-forma
-3.0% appreciation · 0.0% rent growth · sell at horizon
- IRR
- -21.8%
- Equity multiple
- 0.27×
- Total profit
- $-1,079,046
- Equity at exit
- $782,792
- IRR
- -25.2%
- Equity multiple
- -0.06×
- Total profit
- $-1,563,565
- Equity at exit
- $453,924
Cash invested: $1,470,000 (down + closing). Projections, not guarantees.
Landlord ↔ Tenant lean methodology
- Overall (STATE)
- 28 Tenant-Leaning
- State Washington
- 28 Tenant-Leaning · D+8
- County
- — inherits STATE
- City
- — inherits STATE
ZIP-level market 98383
- Home prices YoY
- -26.7%
- Rents YoY
- -2.0%
- Active inventory
- 120
- Price-to-rent
- 199.2×
Monthly cashflow live
- Estimated rent
- $43,934 medium interval (Pro) →
- Mortgage (P&I)
- −$27,532
- Tax est. 1.5%
- −$6,562 /mo · $78,750/yr
- Insurance
- −$2,188
- HOA
- −$0
- Vacancy / Maint / Mgmt
- −$9,226
- Net cashflow
- $-1,574
Break-even live
20-unit breakdown (identical units grouped — click to expand)
| Units | Beds | Baths | Est. rent |
|---|---|---|---|
| 20× units | 36 | 20 | $43,940 |
| #1 | 36 | 20 | $2,197 |
| #2 | 36 | 20 | $2,197 |
| #3 | 36 | 20 | $2,197 |
| #4 | 36 | 20 | $2,197 |
| #5 | 36 | 20 | $2,197 |
| #6 | 36 | 20 | $2,197 |
| #7 | 36 | 20 | $2,197 |
| #8 | 36 | 20 | $2,197 |
| #9 | 36 | 20 | $2,197 |
| #10 | 36 | 20 | $2,197 |
| #11 | 36 | 20 | $2,197 |
| #12 | 36 | 20 | $2,197 |
| #13 | 36 | 20 | $2,197 |
| #14 | 36 | 20 | $2,197 |
| #15 | 36 | 20 | $2,197 |
| #16 | 36 | 20 | $2,197 |
| #17 | 36 | 20 | $2,197 |
| #18 | 36 | 20 | $2,197 |
| #19 | 36 | 20 | $2,197 |
| #20 | 36 | 20 | $2,197 |
| Total (20 units) | $43,934 | ||
UW: 25.0% down · 7.5% · 30yr · 1.5% tax · 5.0% vac · 8.0% maint · 8.0% mgmt
Financing live
Cash to close
- Down payment
- $1,312,500
- Closing costs
- $157,500
- Reserves months
- —
- Total cash needed
- —
Loan-product check · same deal, 3 products live
Conventional
25% down · 7.5% · 30yr
- Down + closing
- —
- Monthly P&I
- —
- Monthly cashflow
- —
- DSCR
- —
- Eligible?
- —
Personal DTI + credit; lowest rate.
DSCR
20% down · 8.5% · 30yr
- Down + closing
- —
- Monthly P&I
- —
- Monthly cashflow
- —
- DSCR
- —
- Eligible?
- —
No personal income docs; deal must DSCR.
Hard money
10% down · 12.0% · 12mo
- Down + closing
- —
- Monthly P&I
- —
- Monthly cashflow
- —
- DSCR
- —
- Eligible?
- —
Short-term bridge; refi at stabilization.
Rent comps 1 comps
| Address | Beds | Baths | Sqft | Rent | $/sqft | DOM | Units | Dist |
|---|---|---|---|---|---|---|---|---|
| 9222 Silverdale Way NW Silverdale, WA | 3.0 | 2.0 | 2100 | $1,645 | $0.78 | 43d | 1 | 0.22mi |
Listing history 38 events
-
2026-06-18days on market $5,250,000 Active 283 DOM
-
2026-06-17days on market $5,250,000 Active 282 DOM
-
2026-06-16days on market $5,250,000 Active 281 DOM
-
2026-06-15days on market $5,250,000 Active 280 DOM
-
2026-06-14days on market $5,250,000 Active 278 DOM
-
2026-06-13days on market $5,250,000 Active 277 DOM
-
2026-06-10days on market $5,250,000 Active 275 DOM
-
2026-06-09days on market $5,250,000 Active 274 DOM
-
2026-06-08days on market $5,250,000 Active 273 DOM
-
2026-06-07days on market $5,250,000 Active 272 DOM
-
2026-06-05days on market $5,250,000 Active 269 DOM
-
2026-06-02days on market $5,250,000 Active 267 DOM
-
2026-06-01days on market $5,250,000 Active 266 DOM
-
2026-05-31days on market $5,250,000 Active 265 DOM
-
2026-05-30days on market $5,250,000 Active 264 DOM
-
2025-12-11historical $1,470
-
2025-11-08historical $1,470
-
2025-09-08$5,250,000 Active
-
2025-07-30$1,470
-
2025-07-30$1,730
-
2025-07-18historical $1,695
-
2025-05-01$1,730
-
2025-05-01historical $1,730
-
2025-04-10$1,730
-
2024-09-25historical $1,430
-
2024-08-30$1,430
-
2024-04-17historical $1,695
-
2024-01-18$1,695
-
2024-01-03historical
-
2023-10-18historical
-
2023-09-19
-
2023-08-17historical
-
2012-10-27historical
-
2012-10-25soldstatus $800,000 Sold
-
2012-10-25soldstatus $800,000
-
2012-05-04status Pending
-
2012-03-03price $845,000
-
2012-02-01$895,000 Active
ⓘ Source: listings_history table (triggers on properties + properties_extension) + one-shot
backfill from property_details.listing_events for pre-trigger history.
Climate risk First Street
- Flood 1/10 Low FEMA zone X (unshaded) · 0% chance over 30 yrs
- Wildfire 1/10 Low
- Heat 3/10 Moderate 7 d/yr ≥86°F today · 16 d/yr by 30 yrs out
- Wind 1/10 Low
- Air quality 7/10 Severe 10 unhealthy d/yr today · 10 by 30 yrs out
Nearby sold comps map
Loading sold comps map…
Walkable amenities ~0.75 mi
Loading nearby amenities…
Taxation est. · year 1
- Rental income
- $527,208
- − Mortgage interest
- −$294,082
- − Property taxes
- −$78,750
- − Insurance
- −$26,250
- − Repairs & maintenance
- −$42,177
- − Management
- −$42,177
- − Depreciation
- −$152,727
- Taxable loss
- −$108,954
- Est. tax savings @ 24.0%
- +$26,149
- After-tax cash flow
- $7,264/yr
For passive investors: Depreciation is non-cash, so a rental often shows a tax loss while cash-flowing — sheltering income. Rental losses are passive: they offset passive income freely, and up to $25,000/yr can offset ordinary (W-2) income if you actively participate and your MAGI is under $100k (phasing out to $0 by $150k); unused losses carry forward. On sale, claimed depreciation is recaptured at up to 25%, and gains may owe capital-gains tax (a 1031 exchange can defer both). Figures are a year-1 estimate at your 24.0% rate — not tax advice; consult a CPA.
Schools (NCES district)
- District
- Central Kitsap School District
- NCES district ID
- 5301080
- Math proficiency
- 55% ▲ 1.00%
- Reading proficiency
- 67% ▬ 0.00%
- Median HH income
- $64,825
- Composite
- 54.87/100
- National rank
- #2813
- State rank
- #49 of 291 in WA
Livability — Silverdale
- Score
- 82/100
- State rank
- #63
- US rank
- #1155
Category grades
Schools grade is shown separately in the Schools card above.
Census & demographics
- Census place
- Silverdale, WA
- County
- Kitsap County · 243,099 people
- City population
- 21,604
- Metro
- Bremerton-Silverdale-Port Orchard, WA
- Population (ZIP)
- 21,604
- Household income
- $111,139
- Rent vs Own
- Severe rent burden
- 878.0
Population outlook (Kitsap County) Hauer SSP2
- Today (2025)
- 277,525 people
- By 2030
- 285,040 · +2.7%
- By 2040
- 294,957 · +6.3%
- By 2050
- 300,622 · +8.3%
- By 2075
- 315,580 · +13.7%
- By 2100
- 304,340 · +9.7%
Race, ethnicity, and origin ACS 2023
- Neighborhood character
- Predominantly White (69%)
- Race & ethnicity
- White 69% Two or more races 11% Asian 8% Hispanic / Latino 8% Black 6%
- Hispanic origin (detail)
- Mexican 7%
- Common ancestry
- Italian 6% Portuguese 5% Slovak 2%
- Foreign-born
- 9% · Canada, Vietnam
- Languages at home
- 90% English-only · Tagalog/Filipino 3% Spanish 3% Other Asian/Pacific 2%
Political lean MEDSL · Kitsap
- 2024 margin
- Strong D (+20.9) · D 58.8% · R 37.9% · Other 3.3%
- 2008→2024 swing
- +8.6pp toward D · 2008: 12.3pp · 2024: 20.9pp
- All cycles
- 2024: D+20.9 2020: D+18.1 2016: D+11.6 2012: D+11.1 2008: D+12.3
Not yet ingested
- Civics
- —
Market trends
- HPI YoY
- ▼ -124.87%
- Current HPI
- 343.44
- Rent YoY
- ▼ -1.99%
- Metro
- Bremerton-Silverdale-Port Orchard, WA
- State GDP YoY
- ▲ 4.65%
- F500 in state
- 22
Industry mix (Fortune 500 HQ in WA)
| Industry | F500 HQs | Revenue |
|---|---|---|
| Retail | 2 | $269B |
|
||
| Technology / Retail | 1 | $638B |
|
||
| Technology | 1 | $245B |
|
||
| Telecommunications | 1 | $38B |
|
||
| Food / Beverage | 1 | $36B |
|
||
| Automotive / Trucks | 1 | $34B |
|
||
Price history
-99.8% since first listed23 events — show timeline
- 2025-12-11 Rental Removed $1,470 Simplifyem
- 2025-11-08 Rental Removed $1,470 Simplifyem
- 2025-09-08 Listed $5,250,000 NWMLS as Distributed by MLS Grid
- 2025-07-30 Listed for Rent $1,470 Simplifyem
- 2025-07-30 Listed for Rent $1,730 Simplifyem
- 2025-07-18 Rental Removed $1,695 Simplifyem
- 2025-05-01 Listed for Rent $1,730 Simplifyem
- 2025-05-01 Rental Removed $1,730 RENT.
- 2025-04-10 Listed for Rent $1,730 RENT.
- 2024-09-25 Rental Removed $1,430 RENT.
- 2024-08-30 Listed for Rent $1,430 RENT.
- 2024-04-17 Rental Removed $1,695 RENT.
- 2024-01-18 Listed for Rent $1,695 RENT.
- 2024-01-03 Rental Removed — RENT.
- 2023-10-18 Rental Removed — RENT.
- 2023-09-19 Listed for Rent — RENT.
- 2023-08-17 Rental Removed — RENT.
- 2012-10-27 Delisted — NWMLS as Distributed by MLS Grid
- 2012-10-25 Sold (Public Records) $800,000 Public Records
- 2012-10-25 Sold (MLS) $800,000 NWMLS as Distributed by MLS Grid
- 2012-05-04 Pending — NWMLS as Distributed by MLS Grid
- 2012-03-03 Price Changed $845,000 NWMLS as Distributed by MLS Grid
- 2012-02-01 Listed $895,000 NWMLS as Distributed by MLS Grid
Property tax history
+4.6%/yrLatest (2026): $5,503 · +1.2% YoY. Source: county tax records.
Cash-flow waterfall
monthlySold comps — $/sqft
last 12 mo · ≤1 miLoading sold comps…