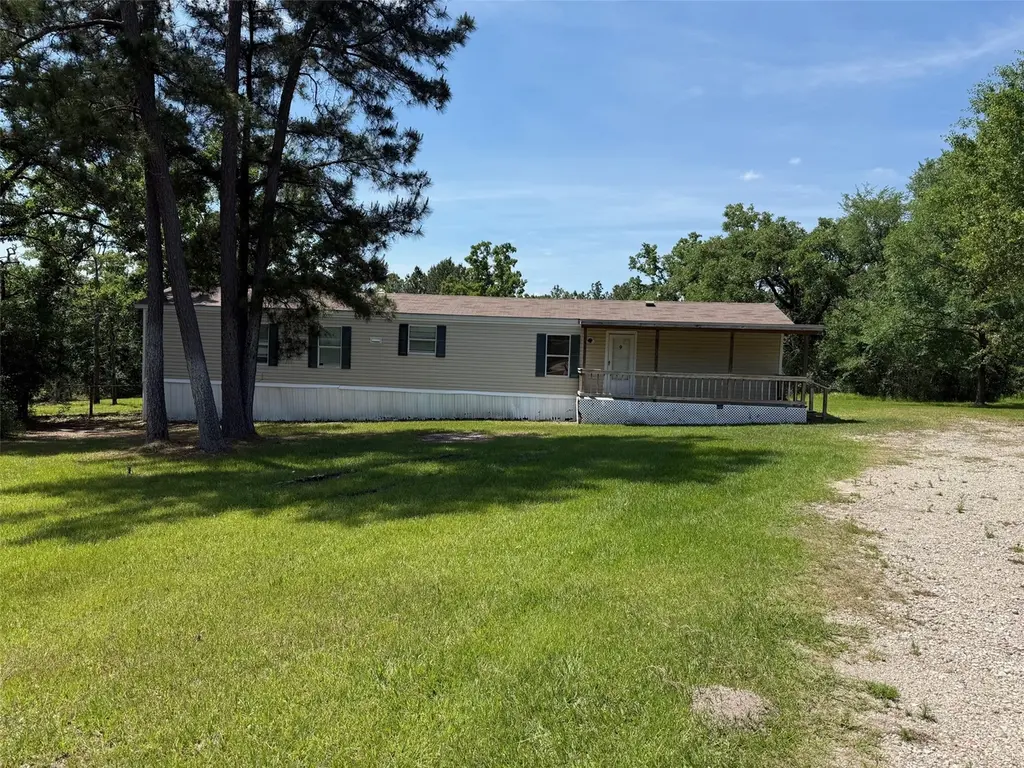
107 Twin Creek Dr
Riverside, TX 77320
$129,500D+
2 bd · 2.0 ba ·
1,208 sqft ·
Built 1998
· Manufactured
· Pending
· 13 DOM
Cashflow @ list (25.0% down · 7.5%)
Estimated rent
$1,301/mo
Mortgage (P&I)
−$679
Tax + insurance
−$211
HOA
−$0
Vac / Maint / Mgmt
−$273
Net cashflow
$137/mo
Annual
$1,644/yr
Cap rate
7.56%
Cash-on-cash
4.53%
DSCR
1.20
1% rule
1.00%
Cash to close
$36,260
Investor read
- This is a 2-bed/2.0-bath manufactured listed at $130k.
- At list price, monthly cash flow is $137 ($2k/yr) — positive.
- The deal already cash-flows at list — no discount required.
- Meets the 1% rule at list price ($1k rent vs $130k).
- Only 13 days on market — expect competitive offers; lowballing is unlikely to land.
- Local home prices are declining (-3.0%/yr); year-one equity from $895 of loan paydown is wiped out by about $4k of value loss. Plan a longer hold.
- Location reads 59/100 on livability (#1,150 in TX) — a working-class tenant base; expect higher turnover. Strengths: cost of living A+, housing A+; Watch: crime D-, amenities F, commute F.
- Huntsville ISD (town): math 25% / reading 37% proficiency, ranked #621 of 826 in TX (top 75%) — families likely to look elsewhere, expect single-tenant / working-renter base with shorter leases.
- Zoned schools: Scott Johnson El (math 27% / reading 27%, grade F, #2,791 of 4,322 statewide, top 68%, 591 students, 80% FRL); Mance Park Middle (math 26% / reading 25%, grade F, #1,236 of 1,662 statewide, top 76%, 904 students, 74% FRL); Huntsville H S (math 13% / reading 25%, grade F, #1,431 of 1,632 statewide, top 88%, 1,797 students, 68% FRL) — zoned schools average 74% FRL vs 42% district-wide (32 pts higher); higher-poverty schools than district average — tighter screening recommended.
- Market conditions: Rents rising (+2.9%/yr); 520 active listings in the ZIP; 527 units permitted in Walker County in 2024 (0 in 5+ unit buildings).
- Walker County population projected at +29% by 2050 — long-run rental-demand tailwind backs the buy-and-hold thesis.
- Climate carrying-cost: severe wind risk, 99% chance of damaging wind over 30y; major wildfire risk; extreme-heat days projected 7→24/yr by 2055 (HVAC capex compounding) — expect insurance premiums to compound above CPI over the hold.
- Cap rate 7.6% vs local median 4.4% in Riverside — top-decile yield for the area; either an underpriced asset or a hidden risk that comps aren't pricing in. Stress-test before assuming the spread holds.
Questions for listing agent
- Is there a deadline driving the sale (1031 exchange, divorce, estate, relocation)? That informs how much negotiation room exists.
- Schools are F-rated, which usually means shorter tenancies and higher turnover. Who's the typical renter profile here, and what's been the actual vacancy rate?
- Crime grade is D in this area — have there been break-ins, vandalism, or insurance claims at this property in the last 3 years? What carrier currently insures it and at what premium?
- The area grade is low — what's the realistic commute time and amenity access for the typical tenant pool here? Any planned neighborhood developments (good or bad) we should know about?
- What's the average days-on-market for RENTAL listings here right now (not sales)? A rising rental-DOM trend means longer vacancies and softer asking-rent achievability than the comps imply.
- What's the recent tenant-quality profile in this submarket — average credit score on applications, eviction rate, late-payment / NSF rate, and stable-employment percentage? A property-management company in the area should have these aggregated.
- How much new for-sale + rental construction is in the pipeline within 1–3 miles? Heavy new supply typically softens prices + rents 12–24 months out; constrained supply supports both.
CashFlowRE · CFR-HEVQJG2BVE1GPN
· Data 3 weeks ago
cashflowre.app · 2026-05-29