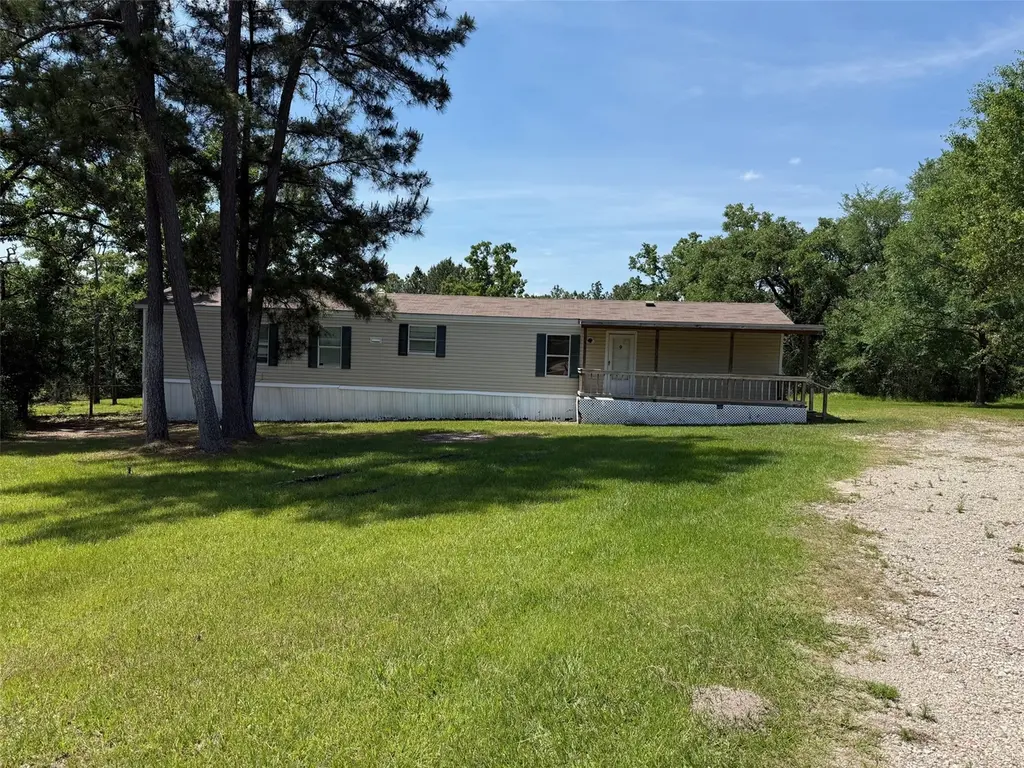
107 Twin Creek Dr · Riverside, TX
Flood risk 4/10 · Minor
- FEMA flood zone
- X (unshaded)
- Chance of flooding over 30 yrs
- 0.22%
- Est. flood insurance / yr
- $507 – $1,088
Fire risk 6/10 · Moderate
- Est. fire insurance / yr
- $1,222 – $2,270
Heat risk 8/10 · Major
- Hot days now (above 111°F)
- 7 days/yr
- Hot days in 30 yrs
- 24 days/yr
Wind risk 8/10 · Major
- Chance of severe wind over 30 yrs
- 99.0%
Air-quality risk 2/10 · Minimal
- Unhealthy air days now
- 0 days/yr
- Unhealthy air days in 30 yrs
- 1 days/yr
Risk factors via First Street. Map © Google.
Why this score? — see what drove the D+ grade
The composite is a weighted blend of 9 inputs, each scored 0–100. Each bar is that input's sub-score; the figure is the points it added to the 100-point composite (weight × sub-score).
- Cash flow +19.1/30.0
- ARV discount +7.5/15.0
- DSCR +6.0/10.0
- 1% rule +5.0/10.0
- Rent growth +3.2/5.0
- Livability +3.0/5.0
- Schools +2.6/10.0
- Condition / age +2.5/5.0
- Appreciation +0.0/10.0
$129,500
🖨 Deal sheet (PDF) 📄 Offer letter ✓ Due diligence
Listing remarks
COUNTRY LIVING NEAR LAKE LIVINGSTON! This two-bedroom, two-bath mobile home offers comfort, privacy, and a beautiful natural setting close to Lake Livingston. It sets away from the road in a yard with established trees. There is a covered front porch. Once you open the front door, you enter an open-concept layout where the living room, dining area, and kitchen flow seamlessly together – perfect for entertaining or relaxing with the family. The dining room has a built-in hutch. The bedrooms are on either end of the home, ensuring privacy. There is a hall bath with tub/shower combo. The primary bedroom has an ensuite bath with double vanities, garden tub, and separate shower. There is a
Key facts
- 2.56 acre lot
- Built 1998
- Listed 13 days
Property features AI
Finance
- Other: Seller disclosure available
- Financial info: Lease not considered
Exterior
- Utilities: Public water; Aerobic septic
- Home design: Residential property; Built in 1998; Block foundation; Composition roof
- Construction: Vinyl siding construction
- Exterior features: Wooded lot
Interior
- Bedrooms: Primary bedroom on the first floor; Second bedroom on the first floor
- Bathrooms: 2 full bathrooms
- Heating & cooling: Central heating (electric); Central air conditioning (electric)
- Interior features: Two total rooms
Neighborhood map
What this means for you Summary
Snapshot
- This is a 2-bed/2.0-bath manufactured listed at $130k.
Deal economics
- At list price, monthly cash flow is $137 ($2k/yr) — positive.
- The deal already cash-flows at list — no discount required.
- Meets the 1% rule at list price ($1k rent vs $130k).
- Cap rate 7.6% vs local median 4.4% in Riverside — top-decile yield for the area; either an underpriced asset or a hidden risk that comps aren't pricing in. Stress-test before assuming the spread holds.
Location & tenants
- Location reads 59/100 on livability (#1,150 in TX) — a working-class tenant base; expect higher turnover. Strengths: cost of living A+, housing A+; Watch: crime D-, amenities F, commute F.
- Huntsville ISD (town): math 25% / reading 37% proficiency, ranked #621 of 826 in TX (top 75%) — families likely to look elsewhere, expect single-tenant / working-renter base with shorter leases.
- Zoned schools: Scott Johnson El (math 27% / reading 27%, grade F, #2,791 of 4,322 statewide, top 68%, 591 students, 80% FRL); Mance Park Middle (math 26% / reading 25%, grade F, #1,236 of 1,662 statewide, top 76%, 904 students, 74% FRL); Huntsville H S (math 13% / reading 25%, grade F, #1,431 of 1,632 statewide, top 88%, 1,797 students, 68% FRL) — zoned schools average 74% FRL vs 42% district-wide (32 pts higher); higher-poverty schools than district average — tighter screening recommended.
- Market conditions: Rents rising (+2.9%/yr); 520 active listings in the ZIP; 527 units permitted in Walker County in 2024 (0 in 5+ unit buildings).
Forward outlook
- Local home prices are declining (-3.0%/yr); year-one equity from $895 of loan paydown is wiped out by about $4k of value loss. Plan a longer hold.
- Walker County population projected at +29% by 2050 — long-run rental-demand tailwind backs the buy-and-hold thesis.
Negotiation context
- Only 13 days on market — expect competitive offers; lowballing is unlikely to land.
Risks & watch-outs
- Climate carrying-cost: severe wind risk, 99% chance of damaging wind over 30y; major wildfire risk; extreme-heat days projected 7→24/yr by 2055 (HVAC capex compounding) — expect insurance premiums to compound above CPI over the hold.
Questions for the listing agent
- Is there a deadline driving the sale (1031 exchange, divorce, estate, relocation)? That informs how much negotiation room exists.
- Schools are F-rated, which usually means shorter tenancies and higher turnover. Who's the typical renter profile here, and what's been the actual vacancy rate?
- Crime grade is D in this area — have there been break-ins, vandalism, or insurance claims at this property in the last 3 years? What carrier currently insures it and at what premium?
- The area grade is low — what's the realistic commute time and amenity access for the typical tenant pool here? Any planned neighborhood developments (good or bad) we should know about?
- What's the average days-on-market for RENTAL listings here right now (not sales)? A rising rental-DOM trend means longer vacancies and softer asking-rent achievability than the comps imply.
- What's the recent tenant-quality profile in this submarket — average credit score on applications, eviction rate, late-payment / NSF rate, and stable-employment percentage? A property-management company in the area should have these aggregated.
- How much new for-sale + rental construction is in the pipeline within 1–3 miles? Heavy new supply typically softens prices + rents 12–24 months out; constrained supply supports both.
Investment metrics
- 1% rule
- 1.00% ✓
- Cap rate
- 7.56%
- Cash-on-cash
- 4.53%
- DSCR
- 1.20
- GRM
- 8.3
CMA / ARV
No comps found within radius.
Projected returns pro-forma
-3.0% appreciation · 2.89% rent growth · sell at horizon
- IRR
- -9.3%
- Equity multiple
- 0.66×
- Total profit
- $-12,388
- Equity at exit
- $19,309
- IRR
- -0.0%
- Equity multiple
- 1.00×
- Total profit
- $-75
- Equity at exit
- $11,197
Cash invested: $36,260 (down + closing). Projections, not guarantees.
Landlord ↔ Tenant lean methodology
- Overall (STATE)
- 87 Strongly Landlord-Friendly
- State Texas
- 87 Strongly Landlord-Friendly · R+5
- County
- — inherits STATE
- City
- — inherits STATE
ZIP-level market 77320
- Home prices YoY
- -33.0%
- Rents YoY
- 2.9%
- Active inventory
- 520
- Price-to-rent
- 8.3×
Monthly cashflow live
- Estimated rent
- $1,301 medium interval (Pro) →
- Mortgage (P&I)
- −$679
- Tax from tax record
- −$157 /mo · $1,889/yr
- Insurance
- −$54
- HOA
- −$0
- Vacancy / Maint / Mgmt
- −$273
- Net cashflow
- $137
Break-even live
Sensitivity live
| Price | -10% $210 | -5% $174 | +0% $137 | +5% $100 | +10% $64 |
|---|---|---|---|---|---|
| Rent | -10% $34 | -5% $86 | +0% $137 | +5% $188 | +10% $240 |
| Rate | -1.0pp $202 | -0.5pp $170 | base $137 | +0.5pp $103 | +1.0pp $69 |
UW: 25.0% down · 7.5% · 30yr · 1.5% tax · 5.0% vac · 8.0% maint · 8.0% mgmt
Financing live
Cash to close
- Down payment
- $32,375
- Closing costs
- $3,885
- Reserves months
- —
- Total cash needed
- —
Loan-product check · same deal, 3 products live
Conventional
25% down · 7.5% · 30yr
- Down + closing
- —
- Monthly P&I
- —
- Monthly cashflow
- —
- DSCR
- —
- Eligible?
- —
Personal DTI + credit; lowest rate.
DSCR
20% down · 8.5% · 30yr
- Down + closing
- —
- Monthly P&I
- —
- Monthly cashflow
- —
- DSCR
- —
- Eligible?
- —
No personal income docs; deal must DSCR.
Hard money
10% down · 12.0% · 12mo
- Down + closing
- —
- Monthly P&I
- —
- Monthly cashflow
- —
- DSCR
- —
- Eligible?
- —
Short-term bridge; refi at stabilization.
Listing history 2 events
-
2026-05-12status Pending 999-char remark
-
2026-05-06$129,500 Active 999-char remark
ⓘ Source: listings_history table (triggers on properties + properties_extension) + one-shot
backfill from property_details.listing_events for pre-trigger history.
Tax reassessment forecast TX · Resets to sale price
- Current annual tax
- $1,889 · $157/mo
- Projected year-2 tax
- $2,370 · $197/mo
- Expected delta
- +$481/yr (+$40/mo · 25.5%)
ⓘ Screening estimate from a state-policy table — verify with the county assessor before closing.
Climate risk First Street
- Flood 4/10 Moderate FEMA zone X (unshaded) · 22% chance over 30 yrs
- Wildfire 6/10 Major
- Heat 8/10 Severe 7 d/yr ≥111°F today · 24 d/yr by 30 yrs out
- Wind 8/10 Severe 99% chance of damaging wind over 30 yrs
- Air quality 2/10 Low 0 unhealthy d/yr today · 1 by 30 yrs out
Nearby sold comps map
Loading sold comps map…
Walkable amenities ~0.75 mi
Loading nearby amenities…
Taxation est. · year 1
- Rental income
- $15,607
- − Mortgage interest
- −$7,254
- − Property taxes
- −$1,889
- − Insurance
- −$648
- − Repairs & maintenance
- −$1,249
- − Management
- −$1,249
- − Depreciation
- −$3,767
- Taxable loss
- −$448
- Est. tax savings @ 24.0%
- +$108
- After-tax cash flow
- $1,751/yr
For passive investors: Depreciation is non-cash, so a rental often shows a tax loss while cash-flowing — sheltering income. Rental losses are passive: they offset passive income freely, and up to $25,000/yr can offset ordinary (W-2) income if you actively participate and your MAGI is under $100k (phasing out to $0 by $150k); unused losses carry forward. On sale, claimed depreciation is recaptured at up to 25%, and gains may owe capital-gains tax (a 1031 exchange can defer both). Figures are a year-1 estimate at your 24.0% rate — not tax advice; consult a CPA.
Schools (NCES district)
- District
- Huntsville ISD
- NCES district ID
- 4824030
- Math proficiency
- 25% ▼ -6.00%
- Reading proficiency
- 37% ▼ -2.00%
- Median HH income
- $36,597
- Composite
- 25.71/100
- National rank
- #7383
- State rank
- #621 of 826 in TX
Livability — Riverside
- Score
- 59/100
- State rank
- #1150
- US rank
- #20204
Category grades
Schools grade is shown separately in the Schools card above.
Census & demographics
- County
- Walker County · 75,669 people
- City population
- 634
- Metro
- Huntsville, TX
- Population (ZIP)
- 38,152
- Household income
- $55,663
- Rent vs Own
- Severe rent burden
- 1030.0
Population outlook (Walker County) Hauer SSP2
- Today (2025)
- 77,602 people
- By 2030
- 82,007 · +5.7%
- By 2040
- 90,436 · +16.5%
- By 2050
- 100,240 · +29.2%
- By 2075
- 123,667 · +59.4%
- By 2100
- 135,073 · +74.1%
Race, ethnicity, and origin ACS 2023
- Neighborhood character
- Diverse neighborhood (Simpson 0.64)
- Race & ethnicity
- White 50% Hispanic / Latino 26% Black 21% Two or more races 15%
- Hispanic origin (detail)
- Mexican 20%
- Common ancestry
- Lithuanian 2% Italian 2% Slovak 2%
- Foreign-born
- 9% · Canada, Vietnam
- Languages at home
- 79% English-only · Spanish 19%
Political lean MEDSL · Walker
- 2024 margin
- Solid R (+40.0) · D 29.6% · R 69.6%
- 2008→2024 swing
- -17.6pp toward R · 2008: -22.4pp · 2024: -40.0pp
- All cycles
- 2024: R+40.0 2020: R+31.7 2016: R+34.5 2012: R+28.4 2008: R+22.4
Not yet ingested
- Civics
- —
Market trends
- HPI YoY
- ▼ -93.48%
- Current HPI
- 190.199
- Rent YoY
- ▲ 2.89%
- Metro
- Huntsville, TX
- State GDP YoY
- ▲ 3.95%
- F500 in state
- 110
Industry mix (Fortune 500 HQ in TX)
| Industry | F500 HQs | Revenue |
|---|---|---|
| Energy | 16 | $1,198B |
|
||
| Technology | 5 | $198B |
|
||
| Engineering / Construction | 4 | $72B |
|
||
| Energy Services | 3 | $60B |
|
||
| Utilities | 3 | $41B |
|
||
| Healthcare | 2 | $330B |
|
||
Price history
3 events — show timeline
- 2026-05-19 Pending — HARMLS
- 2026-05-12 Pending — HARMLS
- 2026-05-06 Listed $129,500 HARMLS
Property tax history
+5.8%/yrLatest (2025): $1,889 · +13.2% YoY. Source: county tax records.
Cash-flow waterfall
monthlySold comps — $/sqft
last 12 mo · ≤1 miLoading sold comps…