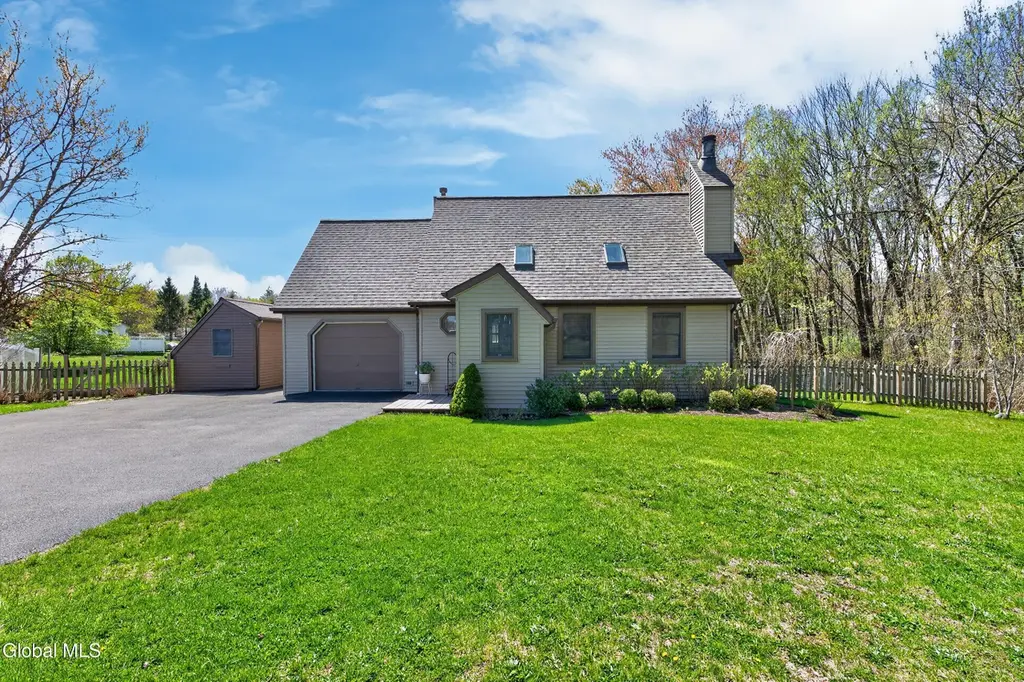
205 Schoolhouse Rd
Westmere, NY 12203
$279,700D-
3 bd · 1.5 ba ·
1,382 sqft ·
Built 1989
· SingleFamily
· Pending
· 6 DOM
Cashflow @ list (25.0% down · 7.5%)
Estimated rent
$2,262/mo
Mortgage (P&I)
−$1,467
Tax + insurance
−$719
HOA
−$0
Vac / Maint / Mgmt
−$475
Net cashflow
$-399/mo
Annual
$-4,787/yr
Cap rate
4.58%
Cash-on-cash
-6.11%
DSCR
0.73
1% rule
0.81%
Cash to close
$78,316
Investor read
- This is a 3-bed/1.5-bath single-family listed at $280k.
- At list price, monthly cash flow is $-399 ($-5k/yr) — negative.
- To cash-flow at today's rent, offer at most $209k (25.2% below list).
- To meet the 1% rule (rent ≥ 1% of price), the offer needs to be $226k (19.1% below list).
- Only 6 days on market — expect competitive offers; lowballing is unlikely to land.
- Recommended offer: $209k (25.2% below list) — sets the bar for cash-flow.
- Local home prices are declining (-3.0%/yr); year-one equity from $2k of loan paydown is wiped out by about $8k of value loss. Plan a longer hold.
- Location reads 69/100 on livability (#477 in NY) — a middle-class / working-renter tenant base. Strengths: housing A+, employment A, health & safety A; Watch: amenities F, commute F, cost of living D-.
- Guilderland Central School District (suburban): math 61% / reading 68% proficiency, ranked #166 of 590 in NY (top 28%) — acceptable for families but not a draw, mixed tenant base, ~2y average lease; only 10% free/reduced lunch — higher-income household profile.
- Zoned schools: Guilderland High School (math 97% / reading 82%, grade A+, #265 of 1,100 statewide, top 26%, 1,462 students, 23% FRL).
- Zoned-school proficiency averages 90% at this address vs 64% district-wide (+25 pts) — the actual schools serving this property are materially stronger than the Guilderland Central School District average implies; a family-tenant draw the district grade alone would hide.
- Watch-outs: property tax is 2.6% of price.
- Market conditions: Rents rising (+1.9%/yr); 124 active listings in the ZIP; 7 comparable units currently listed for rent nearby; rentals at typical pace (median 14d on market — plan ~3-4 weeks tenant-placement turnaround); solid renter incomes; 675 units permitted in Albany County in 2024 (451 in 5+ unit buildings).
- Albany County population projected at +9% by 2050 — modest demand growth; plan on rents tracking national, not racing it.
- 2 sale attempts since 22y ago with the ask held roughly flat each time — persistent listings suggest the price (not the market) is what's stuck; bring a comps-based counter.
- This rent runs 33% of the median local income ($83k/yr) — at the standard rent-burdened threshold; future hikes will face affordability resistance.
Questions for listing agent
- What do current leases actually rent for vs. the listed asking? Can we see a recent rent roll and the last 12 months of T-12 income?
- Property tax is high relative to price — has the assessment been appealed recently, and will the sale trigger a re-assessment?
- Is there a deadline driving the sale (1031 exchange, divorce, estate, relocation)? That informs how much negotiation room exists.
- Schools are B-rated — typically a magnet for longer-tenancy family renters. What's the average tenant stay here, and is there a school-zone premium baked into asking?
- The area grade is low — what's the realistic commute time and amenity access for the typical tenant pool here? Any planned neighborhood developments (good or bad) we should know about?
- What's the average days-on-market for RENTAL listings here right now (not sales)? A rising rental-DOM trend means longer vacancies and softer asking-rent achievability than the comps imply.
- What's the recent tenant-quality profile in this submarket — average credit score on applications, eviction rate, late-payment / NSF rate, and stable-employment percentage? A property-management company in the area should have these aggregated.
- How much new for-sale + rental construction is in the pipeline within 1–3 miles? Heavy new supply typically softens prices + rents 12–24 months out; constrained supply supports both.
CashFlowRE · CFR-HFFC7Q93ESMYX8
· Data 3 weeks ago
cashflowre.app · 2026-05-29