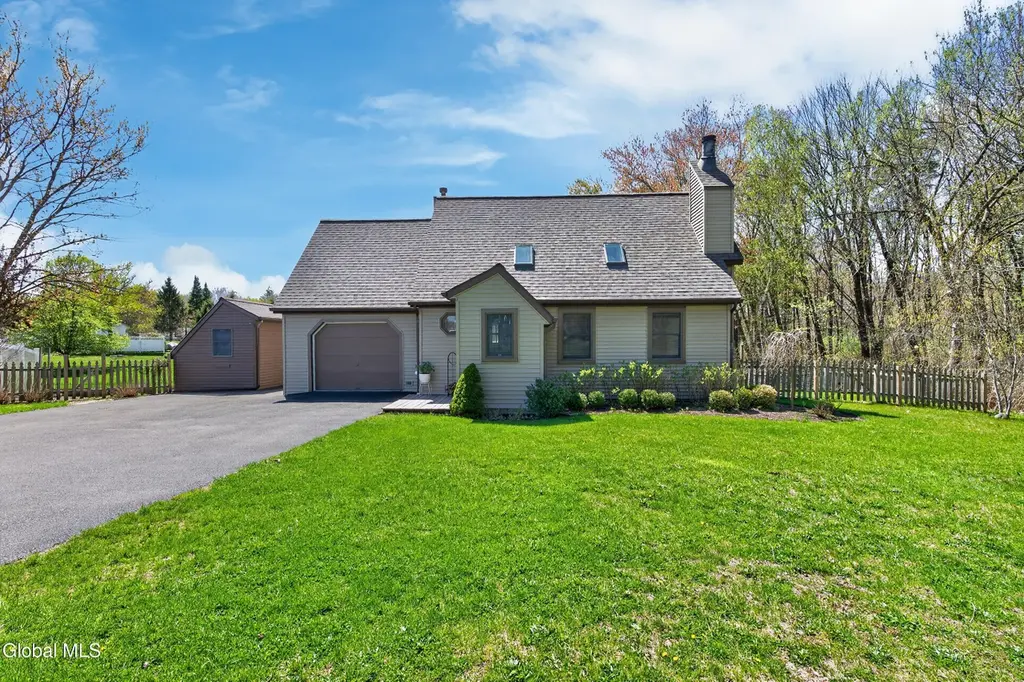
205 Schoolhouse Rd · Westmere, NY
Flood risk 1/10 · Minimal
- FEMA flood zone
- X (unshaded)
- Chance of flooding over 30 yrs
- 0.0%
- Est. flood insurance / yr
- $507 – $1,088
Fire risk 3/10 · Minor
- Est. fire insurance / yr
- $691 – $1,283
Heat risk 4/10 · Minor
- Hot days now (above 98°F)
- 7 days/yr
- Hot days in 30 yrs
- 16 days/yr
Wind risk 3/10 · Minor
- Chance of severe wind over 30 yrs
- 6.0%
Air-quality risk 1/10 · Minimal
- Unhealthy air days now
- 0 days/yr
- Unhealthy air days in 30 yrs
- 0 days/yr
Risk factors via First Street. Map © Google.
Why this score? — see what drove the D- grade
The composite is a weighted blend of 9 inputs, each scored 0–100. Each bar is that input's sub-score; the figure is the points it added to the 100-point composite (weight × sub-score).
- ARV discount +13.5/15.0
- Cash flow +7.1/30.0
- Schools +5.7/10.0
- Livability +3.5/5.0
- 1% rule +3.1/10.0
- Rent growth +3.0/5.0
- Condition / age +2.5/5.0
- DSCR +1.3/10.0
- Appreciation +0.0/10.0
$279,700
🖨 Deal sheet 📄 Offer letter ✓ Due diligence
Listing remarks MLS
PRIDE OF OWNERSHIP EVERYWHERE YOU LOOK/UNIQUE CONTEMPORARY/OPEN PLAN/CEDAR SIDED&VINYL/DETACHED GREENHOUSE/LARGE BEDROOMS/EXTREMELY PRIVATE YARD WOODED/HARDWOOD FLOORS AND PERGO/GREAT ROOM.WOOD FIREPLACE/VAULTED GREAT ROOM/FRESH PAINT FIRST FLOOR LAUNDY/CRAFT ROOM OR STUDY. Excellent Condition
Key facts
- Open concept
- Siding updates
- Furnace updates
Tags
Property features AI
Exterior
- Parking: Attached garage with garage door opener; Total parking for 4 vehicles; 1 garage space
- Utilities: Public water; Public sewer; Cable connected
- Home design: Single-family residence; Main entry on first floor
- Construction: Cedar and vinyl siding; Asphalt roof; Concrete perimeter foundation; Built with crawl space
- Exterior features: Patio; Driveway paved; Garden; Partial fencing; Level lot
Interior
- Kitchen: Dishwasher; Microwave; Range; Refrigerator
- Bedrooms: Three bedrooms on the second floor
- Flooring: Carpet; Hardwood; Laminate
- Bathrooms: One full bathroom on the second floor; One half bathroom on the first floor
- Heating & cooling: Forced-air heating (natural gas); Central air conditioning; Has heating and cooling
- Interior features: Paddle fan; Vaulted ceilings; Sliding doors
- Laundry & utility: Main-level laundry room; Washer and dryer included
Neighborhood map
What this means for you Summary
Snapshot
- This is a 3-bed/1.5-bath single-family listed at $280k.
Deal economics
- At list price, monthly cash flow is $-399 ($-5k/yr) — negative.
- To cash-flow at today's rent, offer at most $209k (25.2% below list).
- To meet the 1% rule (rent ≥ 1% of price), the offer needs to be $226k (19.1% below list).
- Recommended offer: $209k (25.2% below list) — sets the bar for cash-flow.
Location & tenants
- Location reads 69/100 on livability (#477 in NY) — a middle-class / working-renter tenant base. Strengths: housing A+, employment A, health & safety A; Watch: amenities F, commute F, cost of living D-.
- Guilderland Central School District (suburban): math 61% / reading 68% proficiency, ranked #166 of 590 in NY (top 28%) — acceptable for families but not a draw, mixed tenant base, ~2y average lease; only 10% free/reduced lunch — higher-income household profile.
- Zoned schools: Guilderland High School (math 97% / reading 82%, grade A+, #265 of 1,100 statewide, top 26%, 1,462 students, 23% FRL).
- Zoned-school proficiency averages 90% at this address vs 64% district-wide (+25 pts) — the actual schools serving this property are materially stronger than the Guilderland Central School District average implies; a family-tenant draw the district grade alone would hide.
- Market conditions: Rents rising (+1.9%/yr); 124 active listings in the ZIP; 7 comparable units currently listed for rent nearby; rentals at typical pace (median 14d on market — plan ~3-4 weeks tenant-placement turnaround); solid renter incomes; 675 units permitted in Albany County in 2024 (451 in 5+ unit buildings).
- This rent runs 33% of the median local income ($83k/yr) — at the standard rent-burdened threshold; future hikes will face affordability resistance.
Forward outlook
- Local home prices are declining (-3.0%/yr); year-one equity from $2k of loan paydown is wiped out by about $8k of value loss. Plan a longer hold.
- Albany County population projected at +9% by 2050 — modest demand growth; plan on rents tracking national, not racing it.
Negotiation context
- Only 6 days on market — expect competitive offers; lowballing is unlikely to land.
- 2 sale attempts since 22y ago with the ask held roughly flat each time — persistent listings suggest the price (not the market) is what's stuck; bring a comps-based counter.
Risks & watch-outs
- Watch-outs: property tax is 2.6% of price.
Questions for the listing agent
- What do current leases actually rent for vs. the listed asking? Can we see a recent rent roll and the last 12 months of T-12 income?
- Property tax is high relative to price — has the assessment been appealed recently, and will the sale trigger a re-assessment?
- Is there a deadline driving the sale (1031 exchange, divorce, estate, relocation)? That informs how much negotiation room exists.
- Schools are B-rated — typically a magnet for longer-tenancy family renters. What's the average tenant stay here, and is there a school-zone premium baked into asking?
- The area grade is low — what's the realistic commute time and amenity access for the typical tenant pool here? Any planned neighborhood developments (good or bad) we should know about?
- What's the average days-on-market for RENTAL listings here right now (not sales)? A rising rental-DOM trend means longer vacancies and softer asking-rent achievability than the comps imply.
- What's the recent tenant-quality profile in this submarket — average credit score on applications, eviction rate, late-payment / NSF rate, and stable-employment percentage? A property-management company in the area should have these aggregated.
- How much new for-sale + rental construction is in the pipeline within 1–3 miles? Heavy new supply typically softens prices + rents 12–24 months out; constrained supply supports both.
Investment metrics
- 1% rule
- 0.81% ✗
- Cap rate
- 4.58%
- Cash-on-cash
- -6.11%
- DSCR
- 0.73
- GRM
- 10.3
CMA / ARV
- ARV (median comp)
- $322,936
- List price
- $279,700
- Delta
- -13.39%
- Verdict
- UNDERPRICED
- Comps
- 20 within 1.0 mi
Show comp detail 12 sales within ~0.75 mi
| Address | Dist | Beds/Ba | Sqft | Sold | Price | $/sf | Match |
|---|---|---|---|---|---|---|---|
| 113 Marjorie Dr | 0.21mi | 3/1.5 | 1,396 (+1%) | 8mo | $289,000 | $207 | 82 |
| 3 Caroline St | 0.05mi | 4/2.0 (+1) | 1,488 (+8%) | 3mo | $265,000 | $178 | 75 |
| 223 Schoolhouse Rd | 0.13mi | 3/2.0 | 1,300 (-6%) | 9mo | $241,000 | $185 | 74 |
| 99 Vaughn Dr | 0.16mi | 3/2.5 | 1,255 (-9%) | 7mo | $339,000 | $270 | 67 |
| 108 Vaughn Dr | 0.18mi | 3/1.0 | 1,213 (-12%) | 10mo | $270,000 | $223 | 60 |
| 169 Schoolhouse Rd | 0.20mi | 4/2.0 (+1) | 1,586 (+15%) | 2mo | $160,000 | $101 | 58 |
| 220 Woodscape Dr | 0.58mi | 3/2.5 | 1,440 (+4%) | 9mo | $365,000 | $253 | 55 |
| 24-26 E Dillenbeck Dr | 0.74mi | 2/1.0 (-1) | 1,350 (-2%) | 3mo | $273,000 | $202 | 52 |
| 203 Woodscape Dr | 0.60mi | 4/2.0 (+1) | 1,512 (+9%) | 5mo | $420,000 | $278 | 45 |
| 58 E Highland Dr | 0.70mi | 3/2.0 | 1,557 (+13%) | 2mo | $350,000 | $225 | 42 |
| 28 Chapman Dr | 0.73mi | 3/2.0 | 1,538 (+11%) | 8mo | $380,000 | $247 | 39 |
| 20 E Highland Dr | 0.60mi | 3/2.5 | 1,552 (+12%) | 11mo | $432,000 | $278 | 38 |
Match score weights: distance 35% · size 25% · config 20% · recency 20%. Top-matched comps best support the ARV.
Projected returns pro-forma
-3.0% appreciation · 1.85% rent growth · sell at horizon
- IRR
- -28.2%
- Equity multiple
- 0.07×
- Total profit
- $-73,131
- Equity at exit
- $41,704
- IRR
- -32.8%
- Equity multiple
- -0.35×
- Total profit
- $-106,004
- Equity at exit
- $24,183
Cash invested: $78,316 (down + closing). Projections, not guarantees.
Landlord ↔ Tenant lean methodology
- Overall (STATE)
- 15 Strongly Tenant-Friendly
- State New York
- 15 Strongly Tenant-Friendly · D+10
- County
- — inherits STATE
- City
- — inherits STATE
ZIP-level market 12203
- Home prices YoY
- -31.0%
- Rents YoY
- 1.9%
- Active inventory
- 124
- Price-to-rent
- 10.3×
Monthly cashflow live
- Estimated rent
- $2,262 high interval (Pro) →
- Mortgage (P&I)
- −$1,467
- Tax from tax record
- −$602 /mo · $7,230/yr
- Insurance
- −$117
- HOA
- −$0
- Vacancy / Maint / Mgmt
- −$475
- Net cashflow
- $-399
Break-even live
UW: 25.0% down · 7.5% · 30yr · 1.5% tax · 5.0% vac · 8.0% maint · 8.0% mgmt
Financing live
Cash to close
- Down payment
- $69,925
- Closing costs
- $8,391
- Reserves months
- —
- Total cash needed
- —
Loan-product check · same deal, 3 products live
Conventional
25% down · 7.5% · 30yr
- Down + closing
- —
- Monthly P&I
- —
- Monthly cashflow
- —
- DSCR
- —
- Eligible?
- —
Personal DTI + credit; lowest rate.
DSCR
20% down · 8.5% · 30yr
- Down + closing
- —
- Monthly P&I
- —
- Monthly cashflow
- —
- DSCR
- —
- Eligible?
- —
No personal income docs; deal must DSCR.
Hard money
10% down · 12.0% · 12mo
- Down + closing
- —
- Monthly P&I
- —
- Monthly cashflow
- —
- DSCR
- —
- Eligible?
- —
Short-term bridge; refi at stabilization.
Rent comps 7 comps
| Address | Beds | Baths | Sqft | Rent | $/sqft | DOM | Units | Dist |
|---|---|---|---|---|---|---|---|---|
| 416 Greenhill Ct Albany, NY | 2.0 | 1.5 | 1350 | $2,200 | $1.63 | 43d | 1 | 0.45mi |
| 55 Woodlake Rd Albany, NY | 1.0–2.0 | 1.0–2.0 | 903 | $2,050 | $2.27 | 14d | 1 | 0.54mi |
| 1700 Western Ave Albany, NY | 1.0–2.0 | 1.0–2.0 | 1438 | $2,500 | $1.74 | 14d | 1 | 1.09mi |
| 23 The Concourse Unit 21 Albany, NY | 2.0 | 1.0 | 1200 | $2,000 | $1.67 | 14d | 1 | 1.09mi |
| 32 Moreland Ave Unit NA Albany, NY | 3.0 | 1.5 | 1500 | $2,300 | $1.53 | 21d | 1 | 1.12mi |
| 62 Homestead St Albany, NY | 4.0 | 2.0 | 1600 | $2,600 | $1.62 | 43d | 1 | 1.16mi |
| 190 Church Rd Albany, NY | 3.0 | 1.0 | 875 | $2,600 | $2.97 | 14d | 1 | 1.35mi |
Listing history 6 events
-
2026-05-05status Pending 838-char remark
-
2026-04-29$279,700 Active 838-char remark
-
2004-12-17soldstatus $189,000
-
2004-10-29soldstatus $189,000 298-char remark
Show marketing remark (298 chars)
PRIDE OF OWNERSHIP EVERYWHERE YOU LOOK/UNIQUE CONTEMPORARY/OPEN PLAN/CEDAR SIDED&VINYL/DETACHED GREENHOUSE/LARGE BEDROOMS/EXTREMELY PRIVATE YARD WOODED/HARDWOOD FLOORS AND PERGO/GREAT ROOM.WOOD FIREPLACE/VAULTED GREAT ROOM/FRESH PAINT FIRST FLOOR LAUNDY/CRAFT ROOM OR STUDY. Excellent Condition
-
2004-09-15historical 298-char remark
Show marketing remark (298 chars)
PRIDE OF OWNERSHIP EVERYWHERE YOU LOOK/UNIQUE CONTEMPORARY/OPEN PLAN/CEDAR SIDED&VINYL/DETACHED GREENHOUSE/LARGE BEDROOMS/EXTREMELY PRIVATE YARD WOODED/HARDWOOD FLOORS AND PERGO/GREAT ROOM.WOOD FIREPLACE/VAULTED GREAT ROOM/FRESH PAINT FIRST FLOOR LAUNDY/CRAFT ROOM OR STUDY. Excellent Condition
-
2004-08-09$189,900 298-char remark
Show marketing remark (298 chars)
PRIDE OF OWNERSHIP EVERYWHERE YOU LOOK/UNIQUE CONTEMPORARY/OPEN PLAN/CEDAR SIDED&VINYL/DETACHED GREENHOUSE/LARGE BEDROOMS/EXTREMELY PRIVATE YARD WOODED/HARDWOOD FLOORS AND PERGO/GREAT ROOM.WOOD FIREPLACE/VAULTED GREAT ROOM/FRESH PAINT FIRST FLOOR LAUNDY/CRAFT ROOM OR STUDY. Excellent Condition
ⓘ Source: listings_history table (triggers on properties + properties_extension) + one-shot
backfill from property_details.listing_events for pre-trigger history.
Tax reassessment forecast NY · Partial reset (capped growth)
- Current annual tax
- $7,230 · $602/mo
- Projected year-2 tax
- $7,230 · $602/mo
- Expected delta
- $0/yr ($0/mo · 0.0%)
ⓘ Screening estimate from a state-policy table — verify with the county assessor before closing.
Climate risk First Street
- Flood 1/10 Low FEMA zone X (unshaded) · 0% chance over 30 yrs
- Wildfire 3/10 Moderate
- Heat 4/10 Moderate 7 d/yr ≥98°F today · 16 d/yr by 30 yrs out
- Wind 3/10 Moderate 6% chance of damaging wind over 30 yrs
- Air quality 1/10 Low 0 unhealthy d/yr today · 0 by 30 yrs out
Nearby sold comps map
Loading sold comps map…
Walkable amenities ~0.75 mi
Loading nearby amenities…
Taxation est. · year 1
- Rental income
- $27,142
- − Mortgage interest
- −$15,668
- − Property taxes
- −$7,230
- − Insurance
- −$1,398
- − Repairs & maintenance
- −$2,171
- − Management
- −$2,171
- − Depreciation
- −$8,137
- Taxable loss
- −$9,633
- Est. tax savings @ 24.0%
- +$2,312
- After-tax cash flow
- $-2,475/yr
For passive investors: Depreciation is non-cash, so a rental often shows a tax loss while cash-flowing — sheltering income. Rental losses are passive: they offset passive income freely, and up to $25,000/yr can offset ordinary (W-2) income if you actively participate and your MAGI is under $100k (phasing out to $0 by $150k); unused losses carry forward. On sale, claimed depreciation is recaptured at up to 25%, and gains may owe capital-gains tax (a 1031 exchange can defer both). Figures are a year-1 estimate at your 24.0% rate — not tax advice; consult a CPA.
Schools (NCES district)
- District
- Guilderland Central School District
- NCES district ID
- 3613080
- Math proficiency
- 61% ▼ -8.00%
- Reading proficiency
- 68% ▲ 5.00%
- Median HH income
- $75,669
- Composite
- 57.24/100
- National rank
- #1093
- State rank
- #166 of 590 in NY
Livability — Westmere
- Score
- 69/100
- State rank
- #477
- US rank
- #8403
Category grades
Schools grade is shown separately in the Schools card above.
Census & demographics
- County
- Albany County · 196,626 people
- City population
- 30,080
- Metro
- Albany-Schenectady-Troy, NY
- Population (ZIP)
- 30,771
- Household income
- $83,147
- Rent vs Own
- Severe rent burden
- 1704.0
Population outlook (Albany County) Hauer SSP2
- Today (2025)
- 320,794 people
- By 2030
- 327,401 · +2.1%
- By 2040
- 338,218 · +5.4%
- By 2050
- 348,467 · +8.6%
- By 2075
- 381,693 · +19.0%
- By 2100
- 393,809 · +22.8%
Race, ethnicity, and origin ACS 2023
- Neighborhood character
- Predominantly White (69%)
- Race & ethnicity
- White 69% Black 10% Asian 8% Hispanic / Latino 7% Two or more races 7%
- Hispanic origin (detail)
- Mexican 2% Puerto Rican 2%
- Common ancestry
- Romanian 5% Lithuanian 3% Slovak 2%
- Foreign-born
- 16% · Canada, China, South Korea
- Languages at home
- 82% English-only · Other Indo-European 6% Spanish 3% Russian/Polish/Slavic 2%
Political lean MEDSL · Albany
- 2024 margin
- Strong D (+25.8) · D 62.9% · R 37.1%
- 2008→2024 swing
- -3.6pp toward R · 2008: 29.4pp · 2024: 25.8pp
- All cycles
- 2024: D+25.8 2020: D+31.4 2016: D+24.3 2012: D+31.0 2008: D+29.4
Not yet ingested
- Civics
- —
Market trends
- HPI YoY
- ▼ -133.05%
- Current HPI
- 296.0467
- Rent YoY
- ▲ 1.85%
- Metro
- Albany-Schenectady-Troy, NY
- State GDP YoY
- ▲ 2.60%
- F500 in state
- 92
Industry mix (Fortune 500 HQ in NY)
| Industry | F500 HQs | Revenue |
|---|---|---|
| Financial Services | 10 | $950B |
|
||
| Consumer Goods | 9 | $162B |
|
||
| Insurance | 4 | $225B |
|
||
| Telecommunications | 2 | $144B |
|
||
| Pharmaceuticals | 2 | $112B |
|
||
| Media / Entertainment | 2 | $69B |
|
||
Price history
+85.6% since first listed7 events — show timeline
- 2026-06-11 Sold (MLS) $352,500 Global MLS
- 2026-05-05 Pending — Global MLS
- 2026-04-29 Listed $279,700 Global MLS
- 2004-12-17 Sold (Public Records) $189,000 Public Records
- 2004-10-29 Sold (MLS) $189,000 Global MLS
- 2004-09-15 Listing Removed — Global MLS
- 2004-08-09 Listed $189,900 Global MLS
Property tax history
+4.6%/yrLatest (2025): $7,230 · +2.2% YoY. Source: county tax records.
Cash-flow waterfall
monthlySold comps — $/sqft
last 12 mo · ≤1 miLoading sold comps…