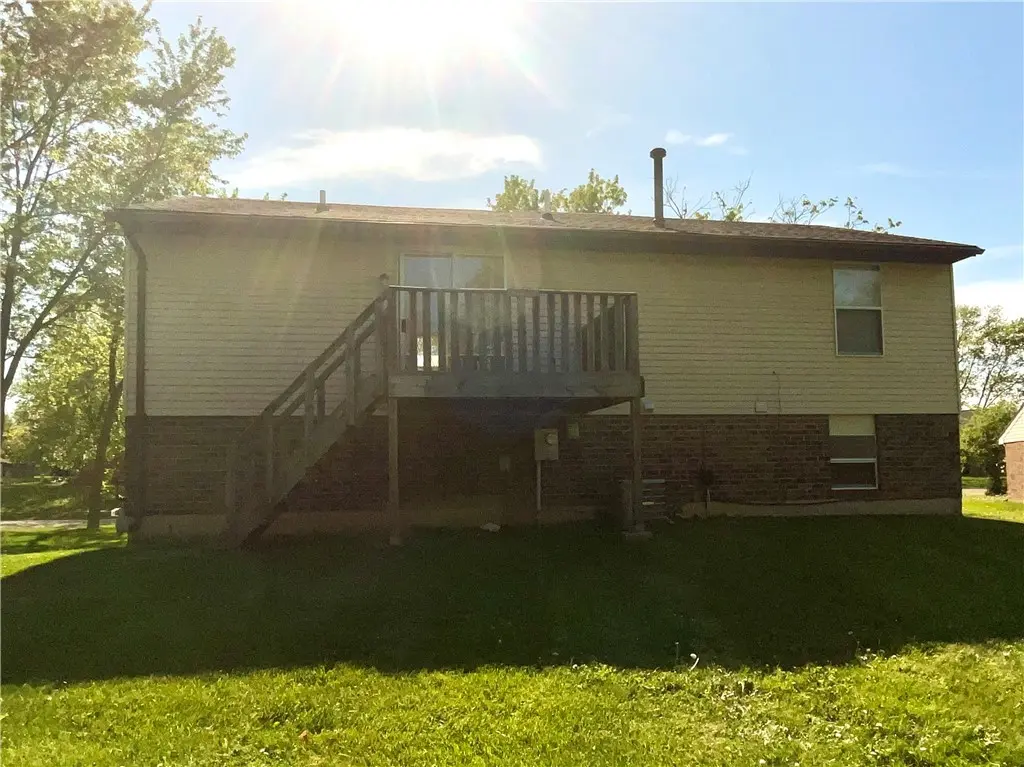
2531 Windsor Village Dr
Centerville, OH 45342
$204,900D
3 bd · 2.0 ba ·
1,426 sqft ·
Built 1984
· SingleFamily
· Pending
· 57 DOM
Cashflow @ list (25.0% down · 7.5%)
Estimated rent
$1,601/mo
Mortgage (P&I)
−$1,075
Tax + insurance
−$465
HOA
−$0
Vac / Maint / Mgmt
−$336
Net cashflow
$-274/mo
Annual
$-3,293/yr
Cap rate
4.69%
Cash-on-cash
-5.74%
DSCR
0.74
1% rule
0.78%
Cash to close
$57,372
Investor read
- This is a 3-bed/2.0-bath single-family listed at $205k.
- At list price, monthly cash flow is $-274 ($-3k/yr) — negative.
- To cash-flow at today's rent, offer at most $156k (23.7% below list).
- To meet the 1% rule (rent ≥ 1% of price), the offer needs to be $160k (21.9% below list).
- It's been on market 57 days — a 3% lower offer ($199k) is reasonable based on typical stale-listing flexibility.
- Recommended offer: $156k (23.7% below list) — sets the bar for cash-flow.
- Local home prices are declining (-3.0%/yr); year-one equity from $1k of loan paydown is wiped out by about $6k of value loss. Plan a longer hold.
- Location reads 85/100 on livability (#45 in OH, #604 nationally) — a professional / high-income tenant draw. Strengths: crime A+, cost of living A+, housing A+; Watch: amenities D+, commute F.
- Miamisburg City (suburban): math 52% / reading 61% proficiency, ranked #338 of 656 in OH (top 52%) — acceptable for families but not a draw, mixed tenant base, ~2y average lease.
- Zoned schools: Bauer Elementary School (math 62% / reading 62%, grade B, #590 of 1,584 statewide, top 41%, 392 students, 48% FRL); Miamisburg Middle School (math 53% / reading 58%, grade B-, #321 of 654 statewide, top 51%, 1,160 students, 44% FRL); Miamisburg High School (math 34% / reading 73%, grade C-, #334 of 781 statewide, top 43%, 1,557 students, 33% FRL).
- Market conditions: Rents rising (+3.3%/yr); 116 active listings in the ZIP; 17 comparable units currently listed for rent nearby; rentals leasing fast (median 5d on market — plan ~1-2 weeks tenant-placement turnaround); solid renter incomes; 907 units permitted in Montgomery County in 2024 (416 in 5+ unit buildings).
- Montgomery County population projected at -10% by 2050 — secular population decline; favor cash flow + early exit over multi-decade hold.
- Cap rate 4.7% vs local median 2.9% in Centerville — top-decile yield for the area; either an underpriced asset or a hidden risk that comps aren't pricing in. Stress-test before assuming the spread holds.
Questions for listing agent
- What do current leases actually rent for vs. the listed asking? Can we see a recent rent roll and the last 12 months of T-12 income?
- It's been on market 57 days. Have you received any prior offers? Is the seller open to a 24% concession, seller financing, or rate buy-down credit?
- Is there a deadline driving the sale (1031 exchange, divorce, estate, relocation)? That informs how much negotiation room exists.
- Schools are A-rated — typically a magnet for longer-tenancy family renters. What's the average tenant stay here, and is there a school-zone premium baked into asking?
- The area grade is low — what's the realistic commute time and amenity access for the typical tenant pool here? Any planned neighborhood developments (good or bad) we should know about?
- What's the average days-on-market for RENTAL listings here right now (not sales)? A rising rental-DOM trend means longer vacancies and softer asking-rent achievability than the comps imply.
- What's the recent tenant-quality profile in this submarket — average credit score on applications, eviction rate, late-payment / NSF rate, and stable-employment percentage? A property-management company in the area should have these aggregated.
- How much new for-sale + rental construction is in the pipeline within 1–3 miles? Heavy new supply typically softens prices + rents 12–24 months out; constrained supply supports both.
CashFlowRE · CFR-HG8DDHBMHBCJPJ
· Data 1 day ago
cashflowre.app · 2026-05-29