2531 Windsor Village Dr · Centerville, OH
Flood risk 1/10 · Minimal
- FEMA flood zone
- X (unshaded)
- Chance of flooding over 30 yrs
- 0.0%
- Est. flood insurance / yr
- $473 – $860
Fire risk 1/10 · Minimal
- Est. fire insurance / yr
- $713 – $1,323
Heat risk 3/10 · Minor
- Hot days now (above 100°F)
- 7 days/yr
- Hot days in 30 yrs
- 19 days/yr
Wind risk 2/10 · Minimal
- Chance of severe wind over 30 yrs
- 1.0%
Air-quality risk 4/10 · Minor
- Unhealthy air days now
- 4 days/yr
- Unhealthy air days in 30 yrs
- 5 days/yr
Risk factors via First Street. Map © Google.
Why this score? — see what drove the D grade
The composite is a weighted blend of 9 inputs, each scored 0–100. Each bar is that input's sub-score; the figure is the points it added to the 100-point composite (weight × sub-score).
- ARV discount +15.0/15.0
- Cash flow +7.4/30.0
- Schools +4.8/10.0
- Livability +4.2/5.0
- Rent growth +3.3/5.0
- 1% rule +2.9/10.0
- Condition / age +2.5/5.0
- DSCR +1.5/10.0
- Appreciation +0.0/10.0
$204,900
🖨 Deal sheet (PDF) 📄 Offer letter ✓ Due diligence
Listing remarks
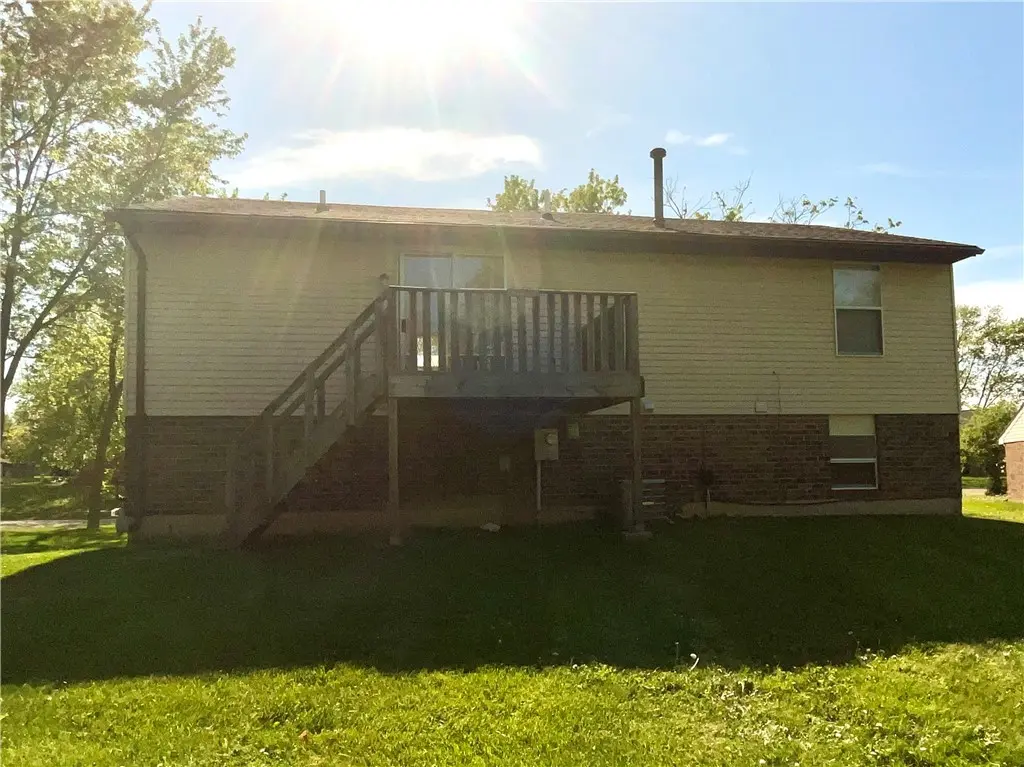
Welcome to this spacious and inviting 3-bedroom bi-level home, perfectly located in the desirable Village Miami neighborhood. Built in 1984, this residence offers over 1,400 square feet of versatile living space, including a formal dining room and a cozy lower-level family room. The clever bi-level design maximizes every inch, providing two full baths and a built-in two-car garage for ultimate convenience. You'll love the large rear deck that overlooks a private, fenced backyard—a perfect spot for summer BBQs. Located just minutes from the Dayton Mall, Austin Landing, and local parks, this home combines suburban tranquility with easy access to the region's best shopping and dining.
Key facts
- Bi-level home
- Formal dining room
- Large rear deck
Tags
Property features AI
Finance
- Financial info: Offered for sale
Exterior
- Parking: Attached two-car garage
- Home design: Residential property
- Construction: Brick and vinyl siding construction
- Exterior features: Residential lot approximately 0.2 acres (66 x 132)
Interior
- Kitchen: Range; Refrigerator
- Bedrooms: Three bedrooms on the second level
- Bathrooms: Two full bathrooms (one on the main level)
- Heating & cooling: Forced air heating; Central air conditioning
- Interior features: Full basement
Neighborhood map
What this means for you Summary
Snapshot
- This is a 3-bed/2.0-bath single-family listed at $205k.
Deal economics
- At list price, monthly cash flow is $-266 ($-3k/yr) — negative.
- To cash-flow at today's rent, offer at most $158k (23.0% below list).
- To meet the 1% rule (rent ≥ 1% of price), the offer needs to be $161k (21.4% below list).
- Recommended offer: $158k (23.0% below list) — sets the bar for cash-flow.
- Cap rate 4.7% vs local median 2.9% in Centerville — top-decile yield for the area; either an underpriced asset or a hidden risk that comps aren't pricing in. Stress-test before assuming the spread holds.
Location & tenants
- Location reads 85/100 on livability (#45 in OH, #604 nationally) — a professional / high-income tenant draw. Strengths: crime A+, cost of living A+, housing A+; Watch: amenities D+, commute F.
- Miamisburg City (suburban): math 52% / reading 61% proficiency, ranked #338 of 656 in OH (top 52%) — acceptable for families but not a draw, mixed tenant base, ~2y average lease.
- Zoned schools: Bauer Elementary School (math 62% / reading 62%, grade B, #590 of 1,584 statewide, top 41%, 392 students, 48% FRL); Miamisburg Middle School (math 53% / reading 58%, grade B-, #321 of 654 statewide, top 51%, 1,160 students, 44% FRL); Miamisburg High School (math 34% / reading 73%, grade C-, #334 of 781 statewide, top 43%, 1,557 students, 33% FRL).
- Market conditions: Rents rising (+3.3%/yr); 116 active listings in the ZIP; 17 comparable units currently listed for rent nearby; rentals leasing fast (median 5d on market — plan ~1-2 weeks tenant-placement turnaround); solid renter incomes; 907 units permitted in Montgomery County in 2024 (416 in 5+ unit buildings).
Forward outlook
- Local home prices are declining (-3.0%/yr); year-one equity from $1k of loan paydown is wiped out by about $6k of value loss. Plan a longer hold.
- Montgomery County population projected at -10% by 2050 — secular population decline; favor cash flow + early exit over multi-decade hold.
Negotiation context
- It's been on market 57 days — a 3% lower offer ($199k) is reasonable based on typical stale-listing flexibility.
Questions for the listing agent
- What do current leases actually rent for vs. the listed asking? Can we see a recent rent roll and the last 12 months of T-12 income?
- It's been on market 57 days. Have you received any prior offers? Is the seller open to a 23% concession, seller financing, or rate buy-down credit?
- Is there a deadline driving the sale (1031 exchange, divorce, estate, relocation)? That informs how much negotiation room exists.
- Schools are A-rated — typically a magnet for longer-tenancy family renters. What's the average tenant stay here, and is there a school-zone premium baked into asking?
- The area grade is low — what's the realistic commute time and amenity access for the typical tenant pool here? Any planned neighborhood developments (good or bad) we should know about?
- What's the average days-on-market for RENTAL listings here right now (not sales)? A rising rental-DOM trend means longer vacancies and softer asking-rent achievability than the comps imply.
- What's the recent tenant-quality profile in this submarket — average credit score on applications, eviction rate, late-payment / NSF rate, and stable-employment percentage? A property-management company in the area should have these aggregated.
- How much new for-sale + rental construction is in the pipeline within 1–3 miles? Heavy new supply typically softens prices + rents 12–24 months out; constrained supply supports both.
Investment metrics
- 1% rule
- 0.79% ✗
- Cap rate
- 4.73%
- Cash-on-cash
- -5.57%
- DSCR
- 0.75
- GRM
- 10.6
CMA / ARV
- ARV (median comp)
- $266,662
- List price
- $204,900
- Delta
- -23.16%
- Verdict
- UNDERPRICED
- Comps
- 20 within 1.0 mi
Show comp detail 12 sales within ~0.75 mi
| Address | Dist | Beds/Ba | Sqft | Sold | Price | $/sf | Match |
|---|---|---|---|---|---|---|---|
| 2511 Cinnamon Ridge Ct | 0.08mi | 3/2.0 | 1,356 (-5%) | 1mo | $240,000 | $177 | 87 |
| 9683 Pellston Way | 0.13mi | 3/2.5 | 1,566 (+10%) | 2mo | $289,000 | $185 | 74 |
| 2540 Colinda Ct | 0.40mi | 3/2.0 | 1,400 (-2%) | 7mo | $280,000 | $200 | 73 |
| 2389 Windsor Village Dr | 0.20mi | 3/2.5 | 1,543 (+8%) | 4mo | $308,000 | $200 | 72 |
| 2152 Blanton Dr | 0.52mi | 3/2.5 | 1,468 (+3%) | 0mo | $345,000 | $235 | 68 |
| 9469 Country Path Trl | 0.53mi | 3/2.0 | 1,502 (+5%) | 0mo | $330,000 | $220 | 66 |
| 9967 Bannon Ct | 0.27mi | 2/1.5 (-1) | 1,566 (+10%) | 3mo | $180,000 | $115 | 62 |
| 2460 Miami Village Dr | 0.51mi | 3/2.0 | 1,269 (-11%) | 1mo | $275,000 | $217 | 57 |
| 9820 Arlis Ln | 0.46mi | 3/2.5 | 1,584 (+11%) | 3mo | $316,000 | $199 | 55 |
| 9528 Summer Wind Trl | 0.45mi | 3/2.0 | 1,617 (+13%) | 4mo | $315,000 | $195 | 53 |
| 2115 Autumn Haze Trl | 0.54mi | 3/2.5 | 1,620 (+14%) | 7mo | $290,000 | $179 | 45 |
| 2408 Ferndown Dr | 0.63mi | 3/2.5 | 1,621 (+14%) | 2mo | $350,000 | $216 | 44 |
Match score weights: distance 35% · size 25% · config 20% · recency 20%. Top-matched comps best support the ARV.
Projected returns pro-forma
-3.0% appreciation · 3.29% rent growth · sell at horizon
- IRR
- -25.4%
- Equity multiple
- 0.14×
- Total profit
- $-49,599
- Equity at exit
- $30,551
- IRR
- -20.5%
- Equity multiple
- -0.09×
- Total profit
- $-62,686
- Equity at exit
- $17,716
Cash invested: $57,372 (down + closing). Projections, not guarantees.
Landlord ↔ Tenant lean methodology
- Overall (STATE)
- 73 Landlord-Friendly
- State Ohio
- 73 Landlord-Friendly · R+6
- County
- — inherits STATE
- City
- — inherits STATE
ZIP-level market 45342
- Rents YoY
- 3.3%
- Active inventory
- 116
- Price-to-rent
- 10.6×
Monthly cashflow live
- Estimated rent
- $1,611 high interval (Pro) →
- Mortgage (P&I)
- −$1,075
- Tax from tax record
- −$379 /mo · $4,550/yr
- Insurance
- −$85
- HOA
- −$0
- Vacancy / Maint / Mgmt
- −$338
- Net cashflow
- $-266
Break-even live
Sensitivity live
| Price | -10% $-150 | -5% $-208 | +0% $-266 | +5% $-324 | +10% $-382 |
|---|---|---|---|---|---|
| Rent | -10% $-394 | -5% $-330 | +0% $-266 | +5% $-203 | +10% $-139 |
| Rate | -1.0pp $-163 | -0.5pp $-214 | base $-266 | +0.5pp $-319 | +1.0pp $-374 |
UW: 25.0% down · 7.5% · 30yr · 1.5% tax · 5.0% vac · 8.0% maint · 8.0% mgmt
Financing live
Cash to close
- Down payment
- $51,225
- Closing costs
- $6,147
- Reserves months
- —
- Total cash needed
- —
Loan-product check · same deal, 3 products live
Conventional
25% down · 7.5% · 30yr
- Down + closing
- —
- Monthly P&I
- —
- Monthly cashflow
- —
- DSCR
- —
- Eligible?
- —
Personal DTI + credit; lowest rate.
DSCR
20% down · 8.5% · 30yr
- Down + closing
- —
- Monthly P&I
- —
- Monthly cashflow
- —
- DSCR
- —
- Eligible?
- —
No personal income docs; deal must DSCR.
Hard money
10% down · 12.0% · 12mo
- Down + closing
- —
- Monthly P&I
- —
- Monthly cashflow
- —
- DSCR
- —
- Eligible?
- —
Short-term bridge; refi at stabilization.
Rent comps 17 comps
| Address | Beds | Baths | Sqft | Rent | $/sqft | DOM | Units | Dist |
|---|---|---|---|---|---|---|---|---|
| 2419 Cross Village Dr Miamisburg, OH | 2.0 | 2.5 | 1232 | $1,245 | $1.01 | 20d | 1 | 0.13mi |
| 8911 Fox Glove Way Miamisburg, OH | 3.0 | 2.5 | 1416 | $1,725 | $1.22 | 45d | 1 | 0.13mi |
| 2745 Brookshire Ln Miamisburg, OH | 2.0 | 1.5 | 1040 | $1,099 | $1.06 | 20d | 1 | 0.22mi |
| 3091 Sagebrook Dr Miamisburg, OH | 1.0–3.0 | 1.0–2.0 | 977 | $1,650 | $1.69 | 4d | 48 | 0.27mi |
| 2436 Tarpon Bay Dr Miamisburg, OH | 2.0 | 2.5 | 1056 | $1,700 | $1.61 | 5d | 1 | 0.31mi |
| 9403 Captiva Bay Dr Unit 9403 Miamisburg, OH | 3.0 | 2.0 | 1276 | $1,600 | $1.25 | 25d | 1 | 0.33mi |
| 9351 Captiva Bay Dr Miamisburg, OH | 2.0 | 2.5 | 1088 | $1,700 | $1.56 | 25d | 1 | 0.36mi |
| 9600 Summit Point Dr Miamisburg, OH | 2.0 | 1.0–2.0 | 869 | $2,020 | $2.32 | 3d | 14 | 0.37mi |
| 2480 Foxhill Dr Miamisburg, OH | 2.0 | 1.0–2.0 | 795 | $1,560 | $1.96 | 4d | 36 | 0.53mi |
| 2550 Steeplechase Dr Miamisburg, OH | 1.0–2.0 | 1.0–2.0 | 838 | $1,795 | $2.14 | 5d | 22 | 0.58mi |
| 9083 Marquis Dr Miamisburg, OH | 3.0 | 2.0 | 1209 | $2,300 | $1.90 | 4d | 1 | 0.59mi |
| 2991 Austin Springs Blvd Miamisburg, OH | 1.0–3.0 | 1.0–2.0 | 948 | $2,495 | $2.63 | 4d | 20 | 0.77mi |
| 8801 Motter Ln Miamisburg, OH | 1.0–2.0 | 1.0–2.0 | 875 | $1,785 | $2.04 | 4d | 9 | 1.01mi |
| 1570 Spinnaker Way Dayton, OH | 1.0–3.0 | 1.0–2.0 | 982 | $1,760 | $1.79 | 4d | 5 | 1.27mi |
| 1936 Washington West Dr Dayton, OH | 2.0 | 2.0 | 1491 | $1,750 | $1.17 | 4d | 1 | 1.43mi |
| 8470 Towson Blvd Miamisburg, OH | 2.0 | 1.5 | 1050 | $1,188 | $1.13 | 20d | 7 | 1.44mi |
| 8470 Towson Blvd Miamisburg, OH | 2.0 | 1.5 | 1050 | $1,182 | $1.13 | 4d | 9 | 1.49mi |
Listing history 18 events
-
2026-06-21statusdays on market $204,900 Pending 57 DOM
-
2026-06-18days on market $204,900 Active 56 DOM
-
2026-06-17days on market $204,900 Active 55 DOM
-
2026-06-16days on market $204,900 Active 54 DOM
-
2026-06-15days on market $204,900 Active 53 DOM
-
2026-06-14days on market $204,900 Active 51 DOM
-
2026-06-10days on market $204,900 Active 48 DOM
-
2026-06-09pricedays on market $204,900 Active 47 DOM
-
2026-06-08days on market $214,900 Active 46 DOM
-
2026-06-07days on market $214,900 Active 45 DOM
-
2026-06-03days on market $214,900 Active 41 DOM
-
2026-06-02days on market $214,900 Active 40 DOM
-
2026-06-01days on market $214,900 Active 39 DOM
-
2026-05-31days on market $214,900 Active 38 DOM
-
2026-04-23$214,900 Active 696-char remark
-
2025-01-09soldstatus $2,790,000
-
1984-12-28soldstatus $55,900
-
1984-12-28soldstatus $55,900
ⓘ Source: listings_history table (triggers on properties + properties_extension) + one-shot
backfill from property_details.listing_events for pre-trigger history.
Tax reassessment forecast OH · Partial reset (capped growth)
- Current annual tax
- $4,550 · $379/mo
- Projected year-2 tax
- $4,550 · $379/mo
- Expected delta
- $0/yr ($0/mo · 0.0%)
ⓘ Screening estimate from a state-policy table — verify with the county assessor before closing.
Climate risk First Street
- Flood 1/10 Low FEMA zone X (unshaded) · 0% chance over 30 yrs
- Wildfire 1/10 Low
- Heat 3/10 Moderate 7 d/yr ≥100°F today · 19 d/yr by 30 yrs out
- Wind 2/10 Low 100% chance of damaging wind over 30 yrs
- Air quality 4/10 Moderate 4 unhealthy d/yr today · 5 by 30 yrs out
Nearby sold comps map
Loading sold comps map…
Walkable amenities ~0.75 mi
Loading nearby amenities…
Taxation est. · year 1
- Rental income
- $19,331
- − Mortgage interest
- −$11,478
- − Property taxes
- −$4,550
- − Insurance
- −$1,024
- − Repairs & maintenance
- −$1,546
- − Management
- −$1,546
- − Depreciation
- −$5,961
- Taxable loss
- −$6,774
- Est. tax savings @ 24.0%
- +$1,626
- After-tax cash flow
- $-1,571/yr
For passive investors: Depreciation is non-cash, so a rental often shows a tax loss while cash-flowing — sheltering income. Rental losses are passive: they offset passive income freely, and up to $25,000/yr can offset ordinary (W-2) income if you actively participate and your MAGI is under $100k (phasing out to $0 by $150k); unused losses carry forward. On sale, claimed depreciation is recaptured at up to 25%, and gains may owe capital-gains tax (a 1031 exchange can defer both). Figures are a year-1 estimate at your 24.0% rate — not tax advice; consult a CPA.
Schools (NCES district)
- District
- Miamisburg City
- NCES district ID
- 3904439
- Math proficiency
- 52% ▼ -13.00%
- Reading proficiency
- 61% ▼ -7.00%
- Median HH income
- $53,394
- Composite
- 48.47/100
- National rank
- #2128
- State rank
- #338 of 656 in OH
Livability — Centerville
- Score
- 85/100
- State rank
- #45
- US rank
- #604
Category grades
Schools grade is shown separately in the Schools card above.
Census & demographics
- County
- Montgomery County · 459,541 people
- City population
- 38,712
- Metro
- Dayton-Kettering, OH
- Population (ZIP)
- 36,152
- Household income
- $84,907
- Rent vs Own
- Severe rent burden
- 790.0
Population outlook (Montgomery County) Hauer SSP2
- Today (2025)
- 523,241 people
- By 2030
- 514,948 · -1.6%
- By 2040
- 493,378 · -5.7%
- By 2050
- 469,639 · -10.2%
- By 2075
- 418,360 · -20.0%
- By 2100
- 353,315 · -32.5%
Race, ethnicity, and origin ACS 2023
- Neighborhood character
- Predominantly White (83%)
- Race & ethnicity
- White 83% Black 6% Two or more races 4% Asian 4% Hispanic / Latino 3%
- Common ancestry
- Slovak 2% Italian 2% Serbian 2%
- Foreign-born
- 6% · Canada, China
- Languages at home
- 93% English-only · Other Asian/Pacific 3% Spanish 2% Other Indo-European 1%
Political lean MEDSL · Montgomery
- 2024 margin
- Toss-up / Even · D 49.8% · R 49.3%
- 2008→2024 swing
- -5.8pp toward R · 2008: 6.2pp · 2024: 0.5pp
- All cycles
- 2024: D+0.5 2020: D+2.2 2016: R+1.2 2012: D+3.1 2008: D+6.2
Not yet ingested
- Civics
- —
Market trends
- HPI YoY
- ▼ -183.01%
- Current HPI
- 227.3999
- Rent YoY
- ▲ 3.29%
- Metro
- Dayton-Kettering, OH
- State GDP YoY
- ▲ 1.98%
- F500 in state
- 48
Industry mix (Fortune 500 HQ in OH)
| Industry | F500 HQs | Revenue |
|---|---|---|
| Insurance | 3 | $145B |
|
||
| Industrial Machinery | 3 | $49B |
|
||
| Financial Services | 3 | $24B |
|
||
| Consumer Goods | 2 | $93B |
|
||
| Aerospace / Defense | 2 | $47B |
|
||
| Utilities | 2 | $33B |
|
||
Price history
+266.5% since first listed5 events — show timeline
- 2026-06-09 Price Changed $204,900 Dayton MLS
- 2026-04-23 Listed $214,900 Dayton MLS
- 2025-01-09 Sold (Public Records) $2,790,000 Public Records
- 1984-12-28 Sold (Public Records) $55,900 Public Records
- 1984-12-28 Sold (Public Records) $55,900 Public Records
Property tax history
+3.8%/yrLatest (2025): $4,550 · -0.2% YoY. Source: county tax records.
Cash-flow waterfall
monthlySold comps — $/sqft
last 12 mo · ≤1 miLoading sold comps…